
The Land of Math Store
Digital Downloads
This is a collection of different math products you can download. Books are available on Amazon (Tab at the top of the page).
You can also find our products on Teachers Pay Teachers (Link in the upper left)
Box and Whisker Graph (Guide with worksheets)


Box and Whisker Graph (Guide with worksheets)
This is a 16 page Guide and worksheets over the Box and Whisker Plot.
The Guide is 5 pages that shows the "Parts of the Box and Whisker Plot", "How to Read the Box and Whisker," and "How to make the Box and Whisker Plot."
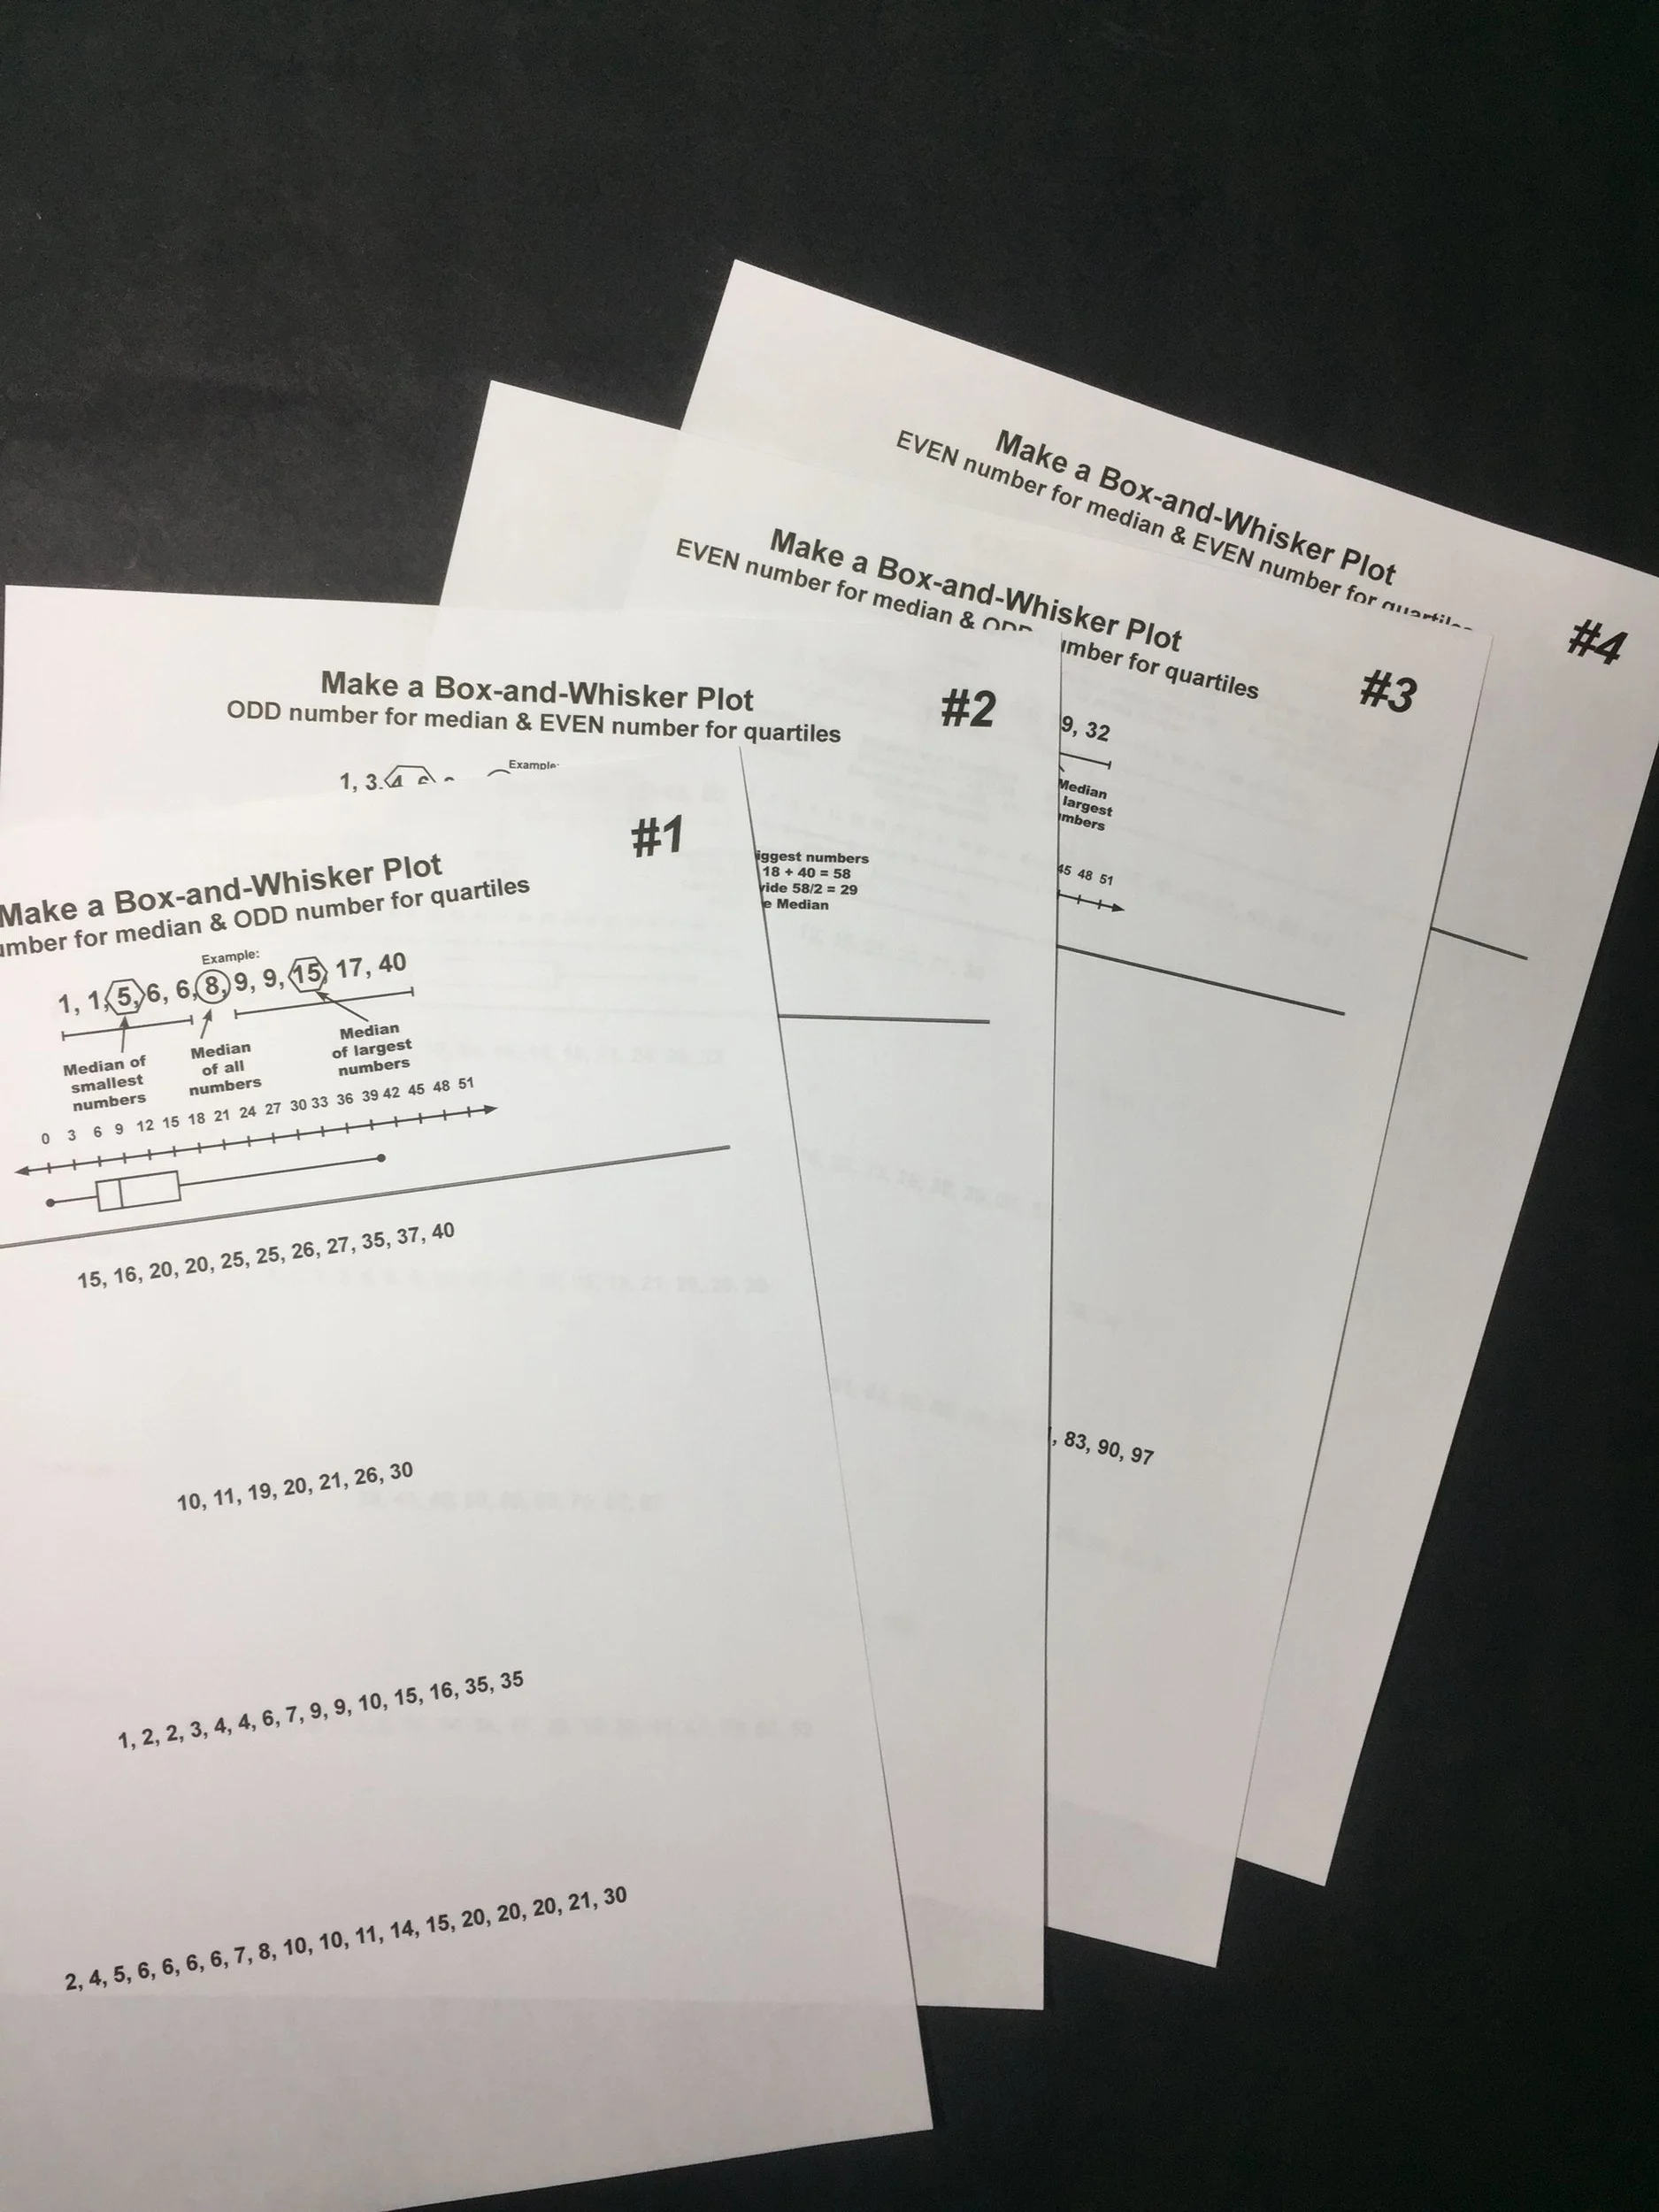
The "How to Make a Box and Whisker Plot" section of the guide has 4 different situations that can occur:
1) Odd total number in the set and and Odd amount when finding the Quartiles
2) Odd total number in the set and and Even amount when finding the Quartiles
3) Even total number in the set and and Odd amount when finding the Quartiles
4) Even total number in the set and and Even amount when finding the Quartiles
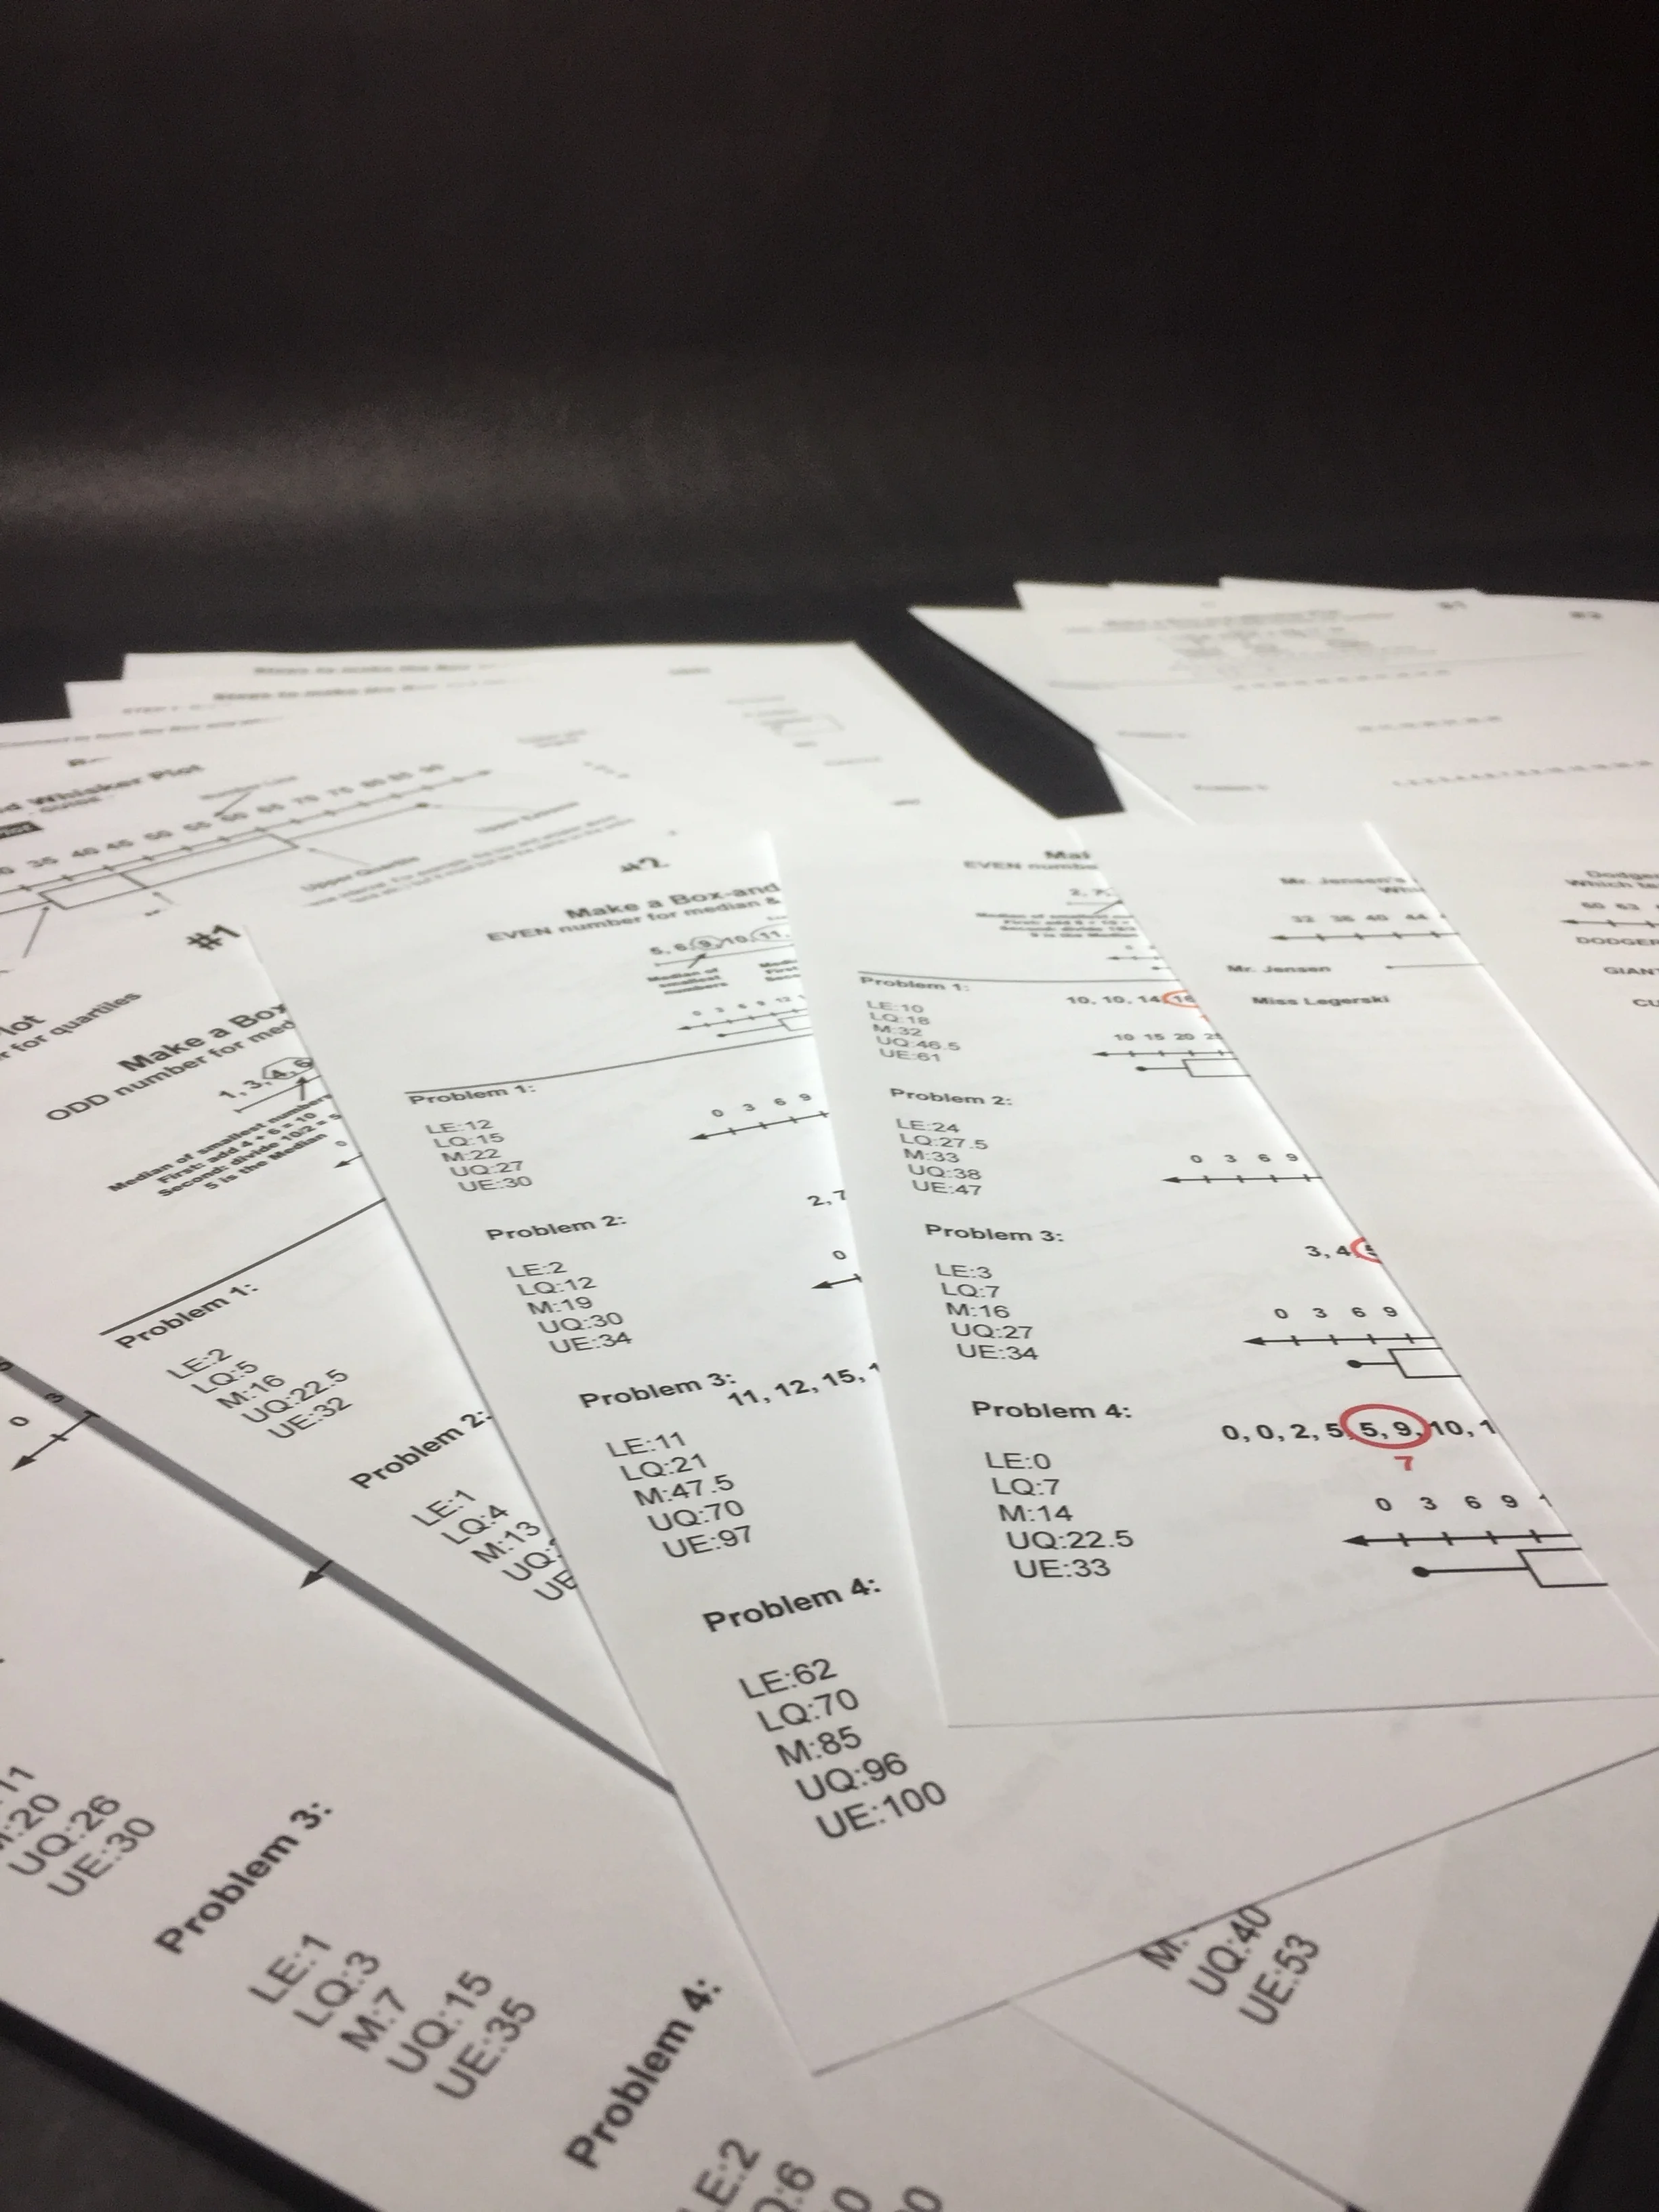
There are 4 worksheets that work on each of the situations above. Each of the work sheets have four problems with answer keys. students will need to find Extremes, Quartiles, and Median. Next, the students will construct a Box and Whisker Plot of the data. (each of these 4 pages has a guide to help students at the top)
There are 2 additional worksheets that have a double (Quiz scores from two math classes) or triple (Comparing the Dodgers, Giants, & Cubs win totals from 2000-16) Box and Whisker Plots. Students will analyze Box and Whisker Plots and make an argument for which was the best. There is no one right answer on these two worksheets. There is data to support any of the answers. This is a good opportunity to have students used data to support their opinion. The answer key for this is a list of different arguments that each side could use.