

Cereal Box Project: A middle school math project (Copy)
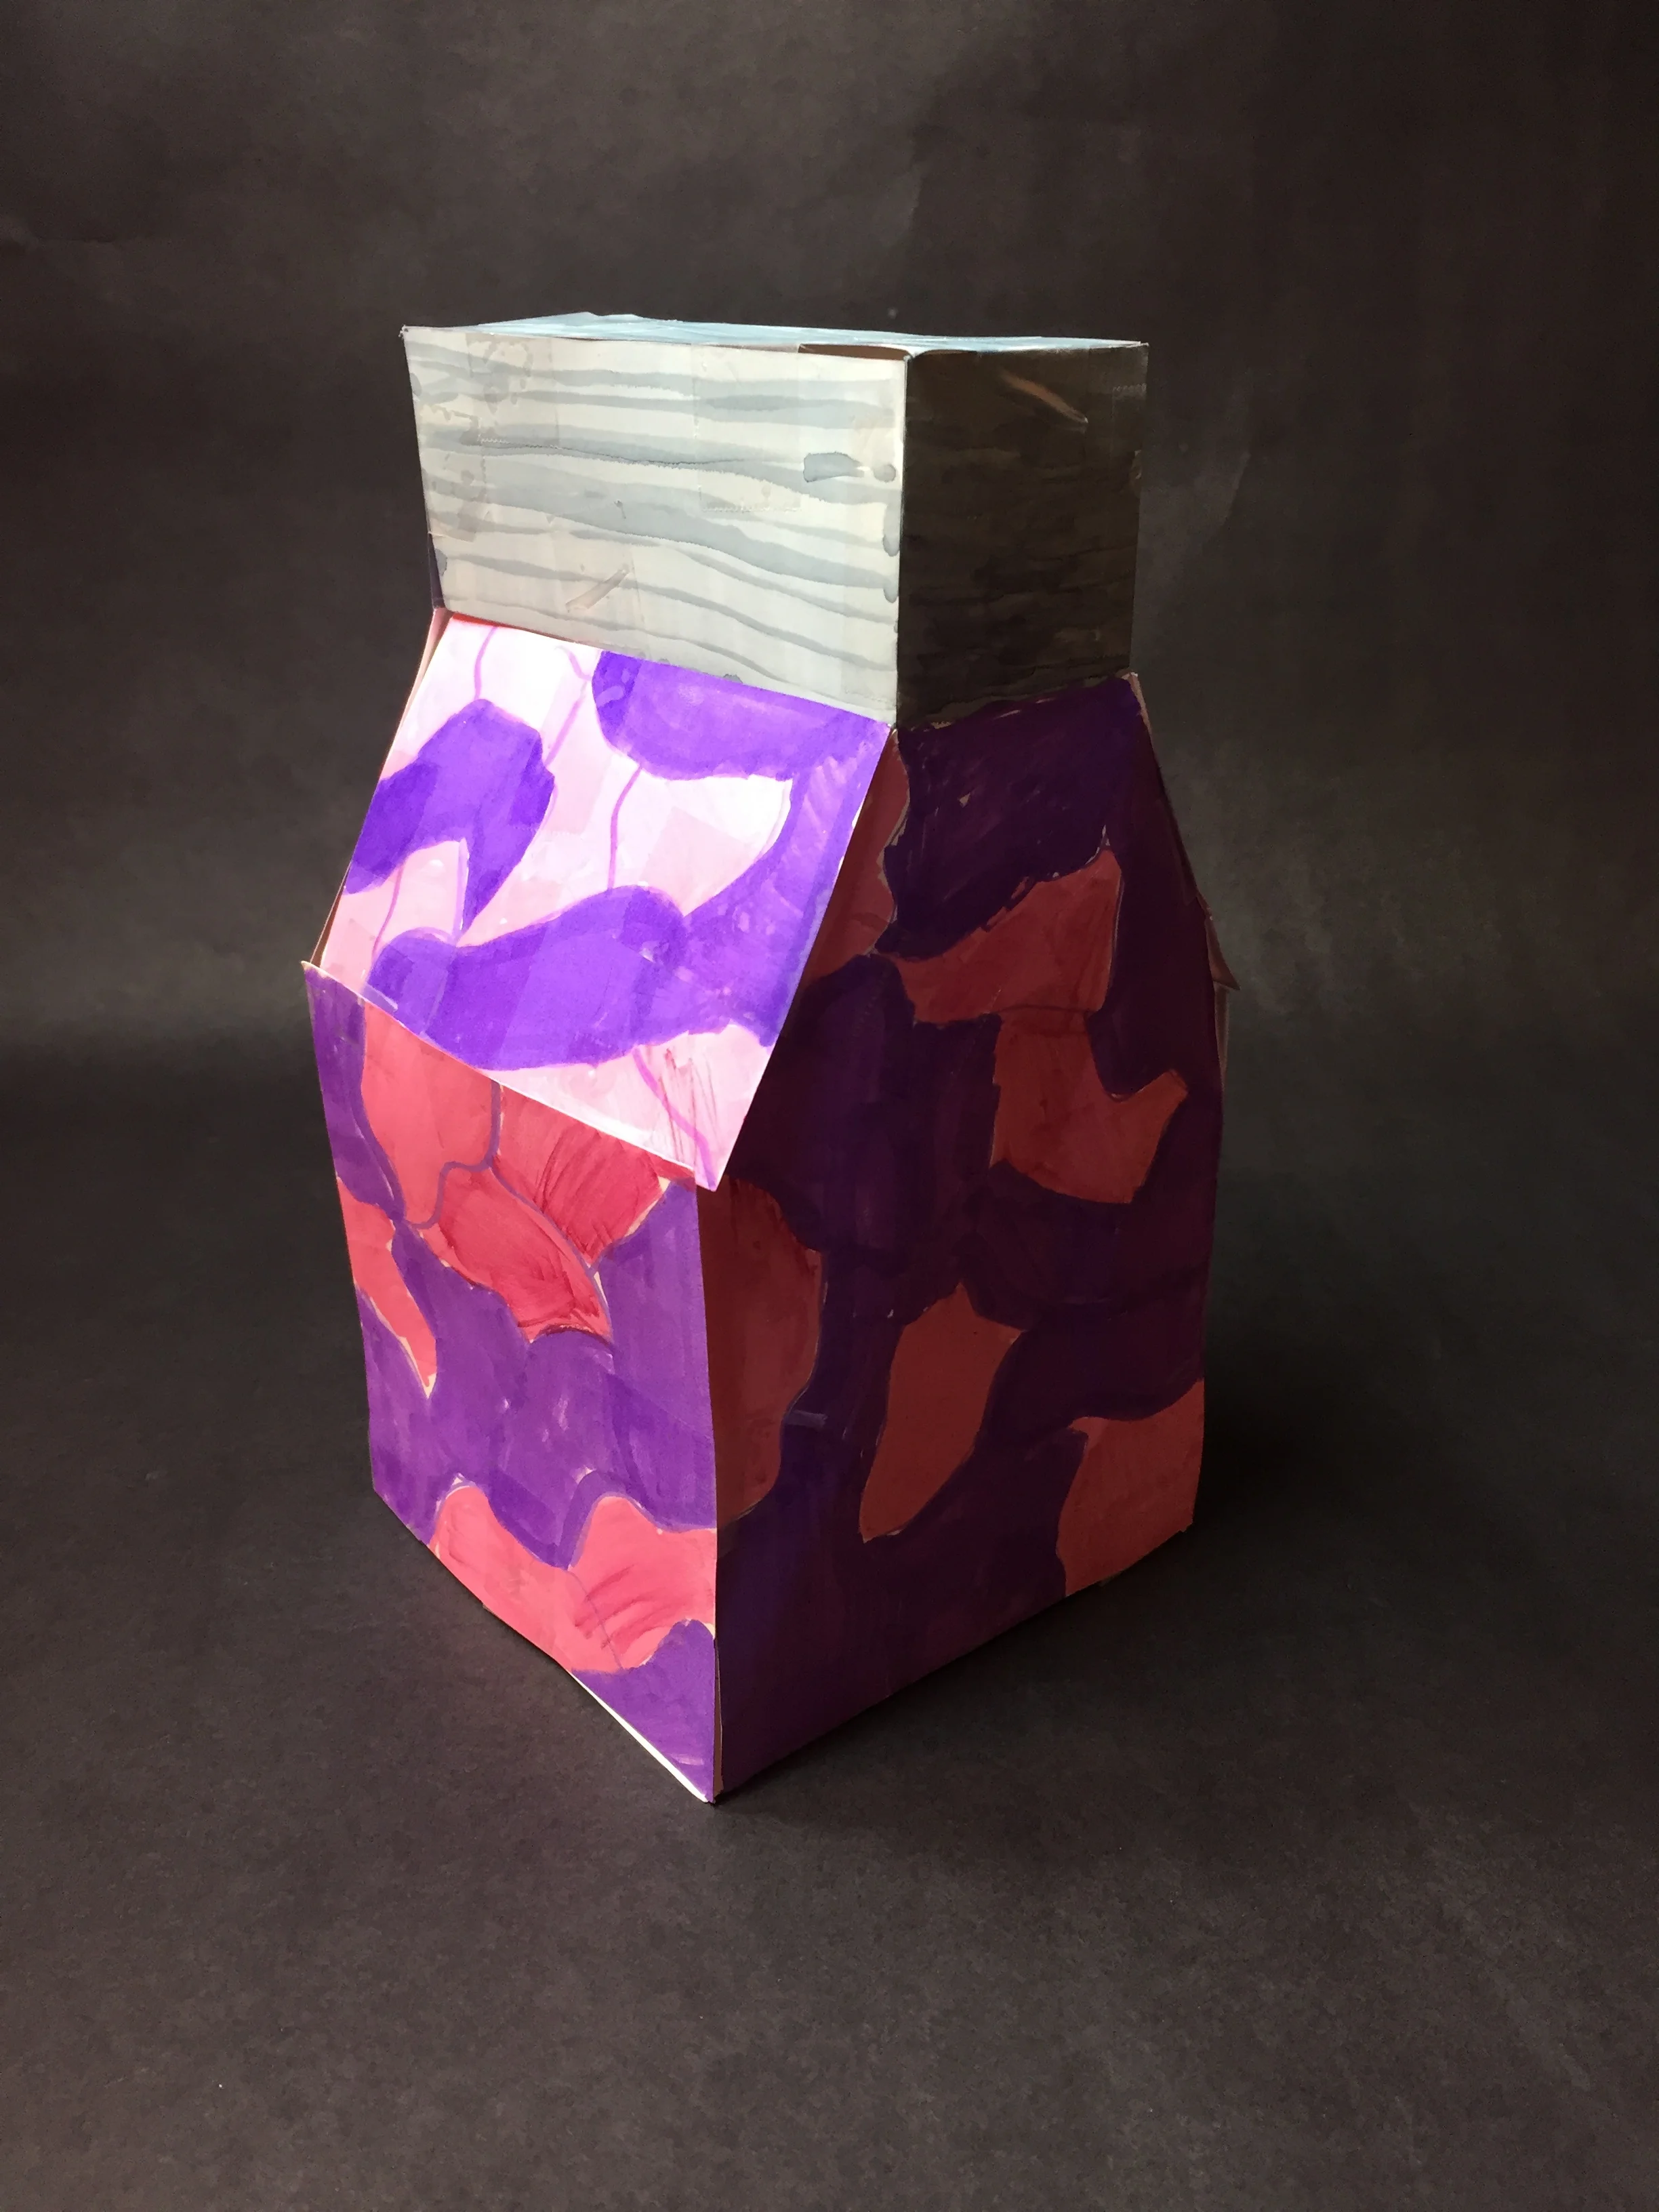
For over a decade the Cereal Box Project has been a staple in our classroom. The idea is that a cereal box company is introducing a new cereal and they want a unique design for the cereal box to help gain extra attention.
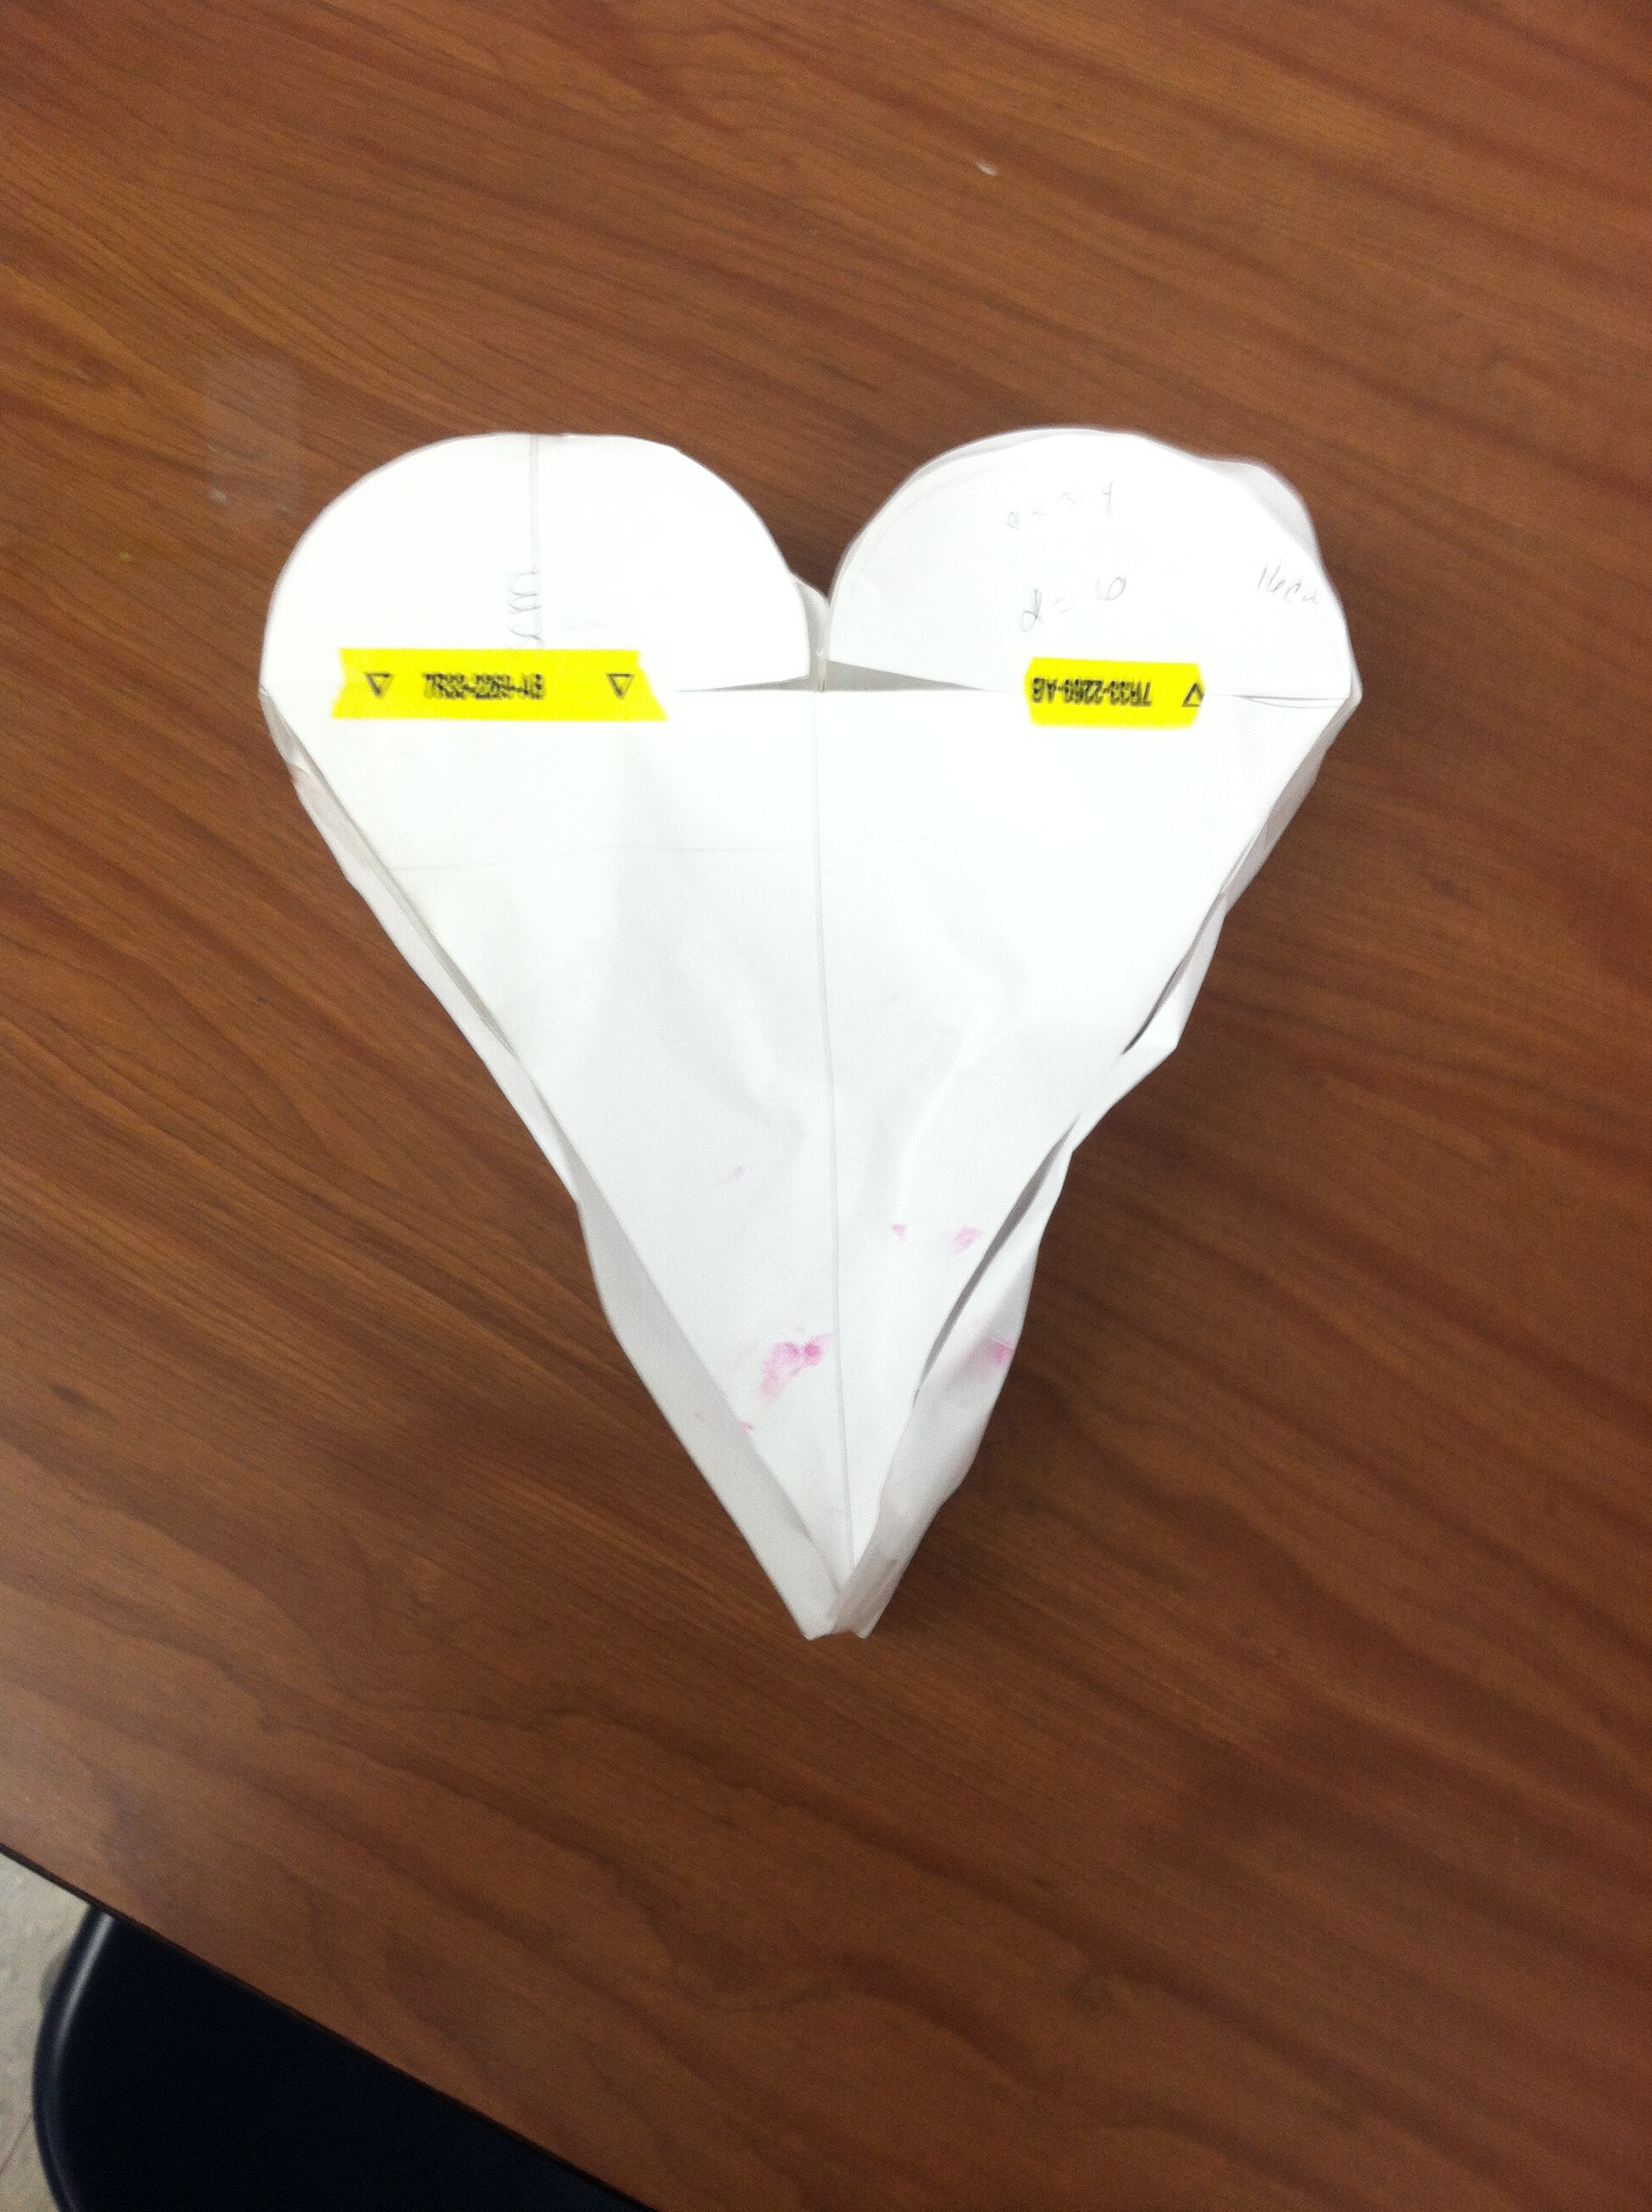
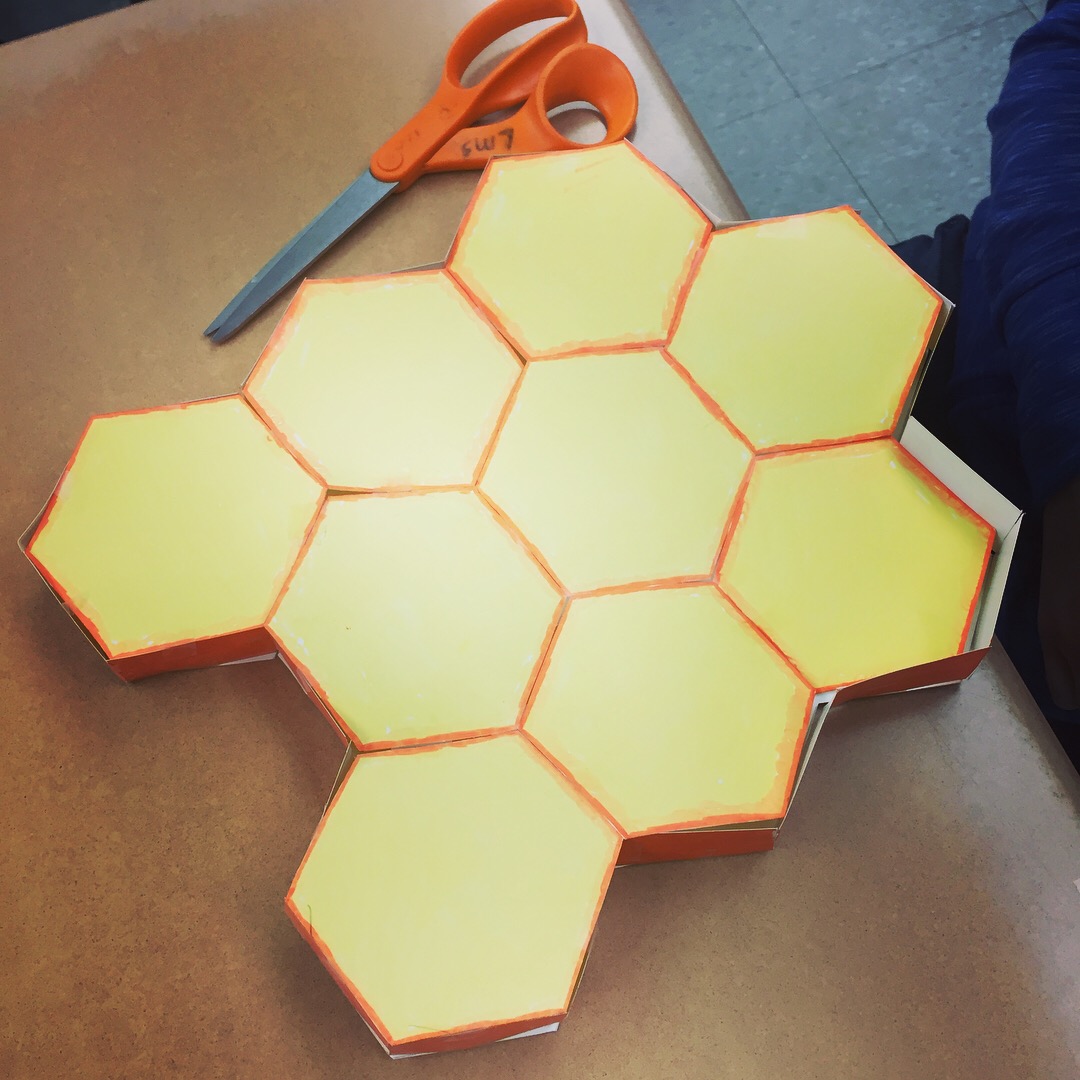
Because the company wants something creative, a simple rectangular prism simply just won't do. The goal is for students to find ways to combine different shapes together to create this eye catching cereal box.
The following is a basic outline of the steps that we follow with this project. In addition, I'm including a few lessons from this years Cereal Box Project experience.
Step 1 - Come up with an Idea

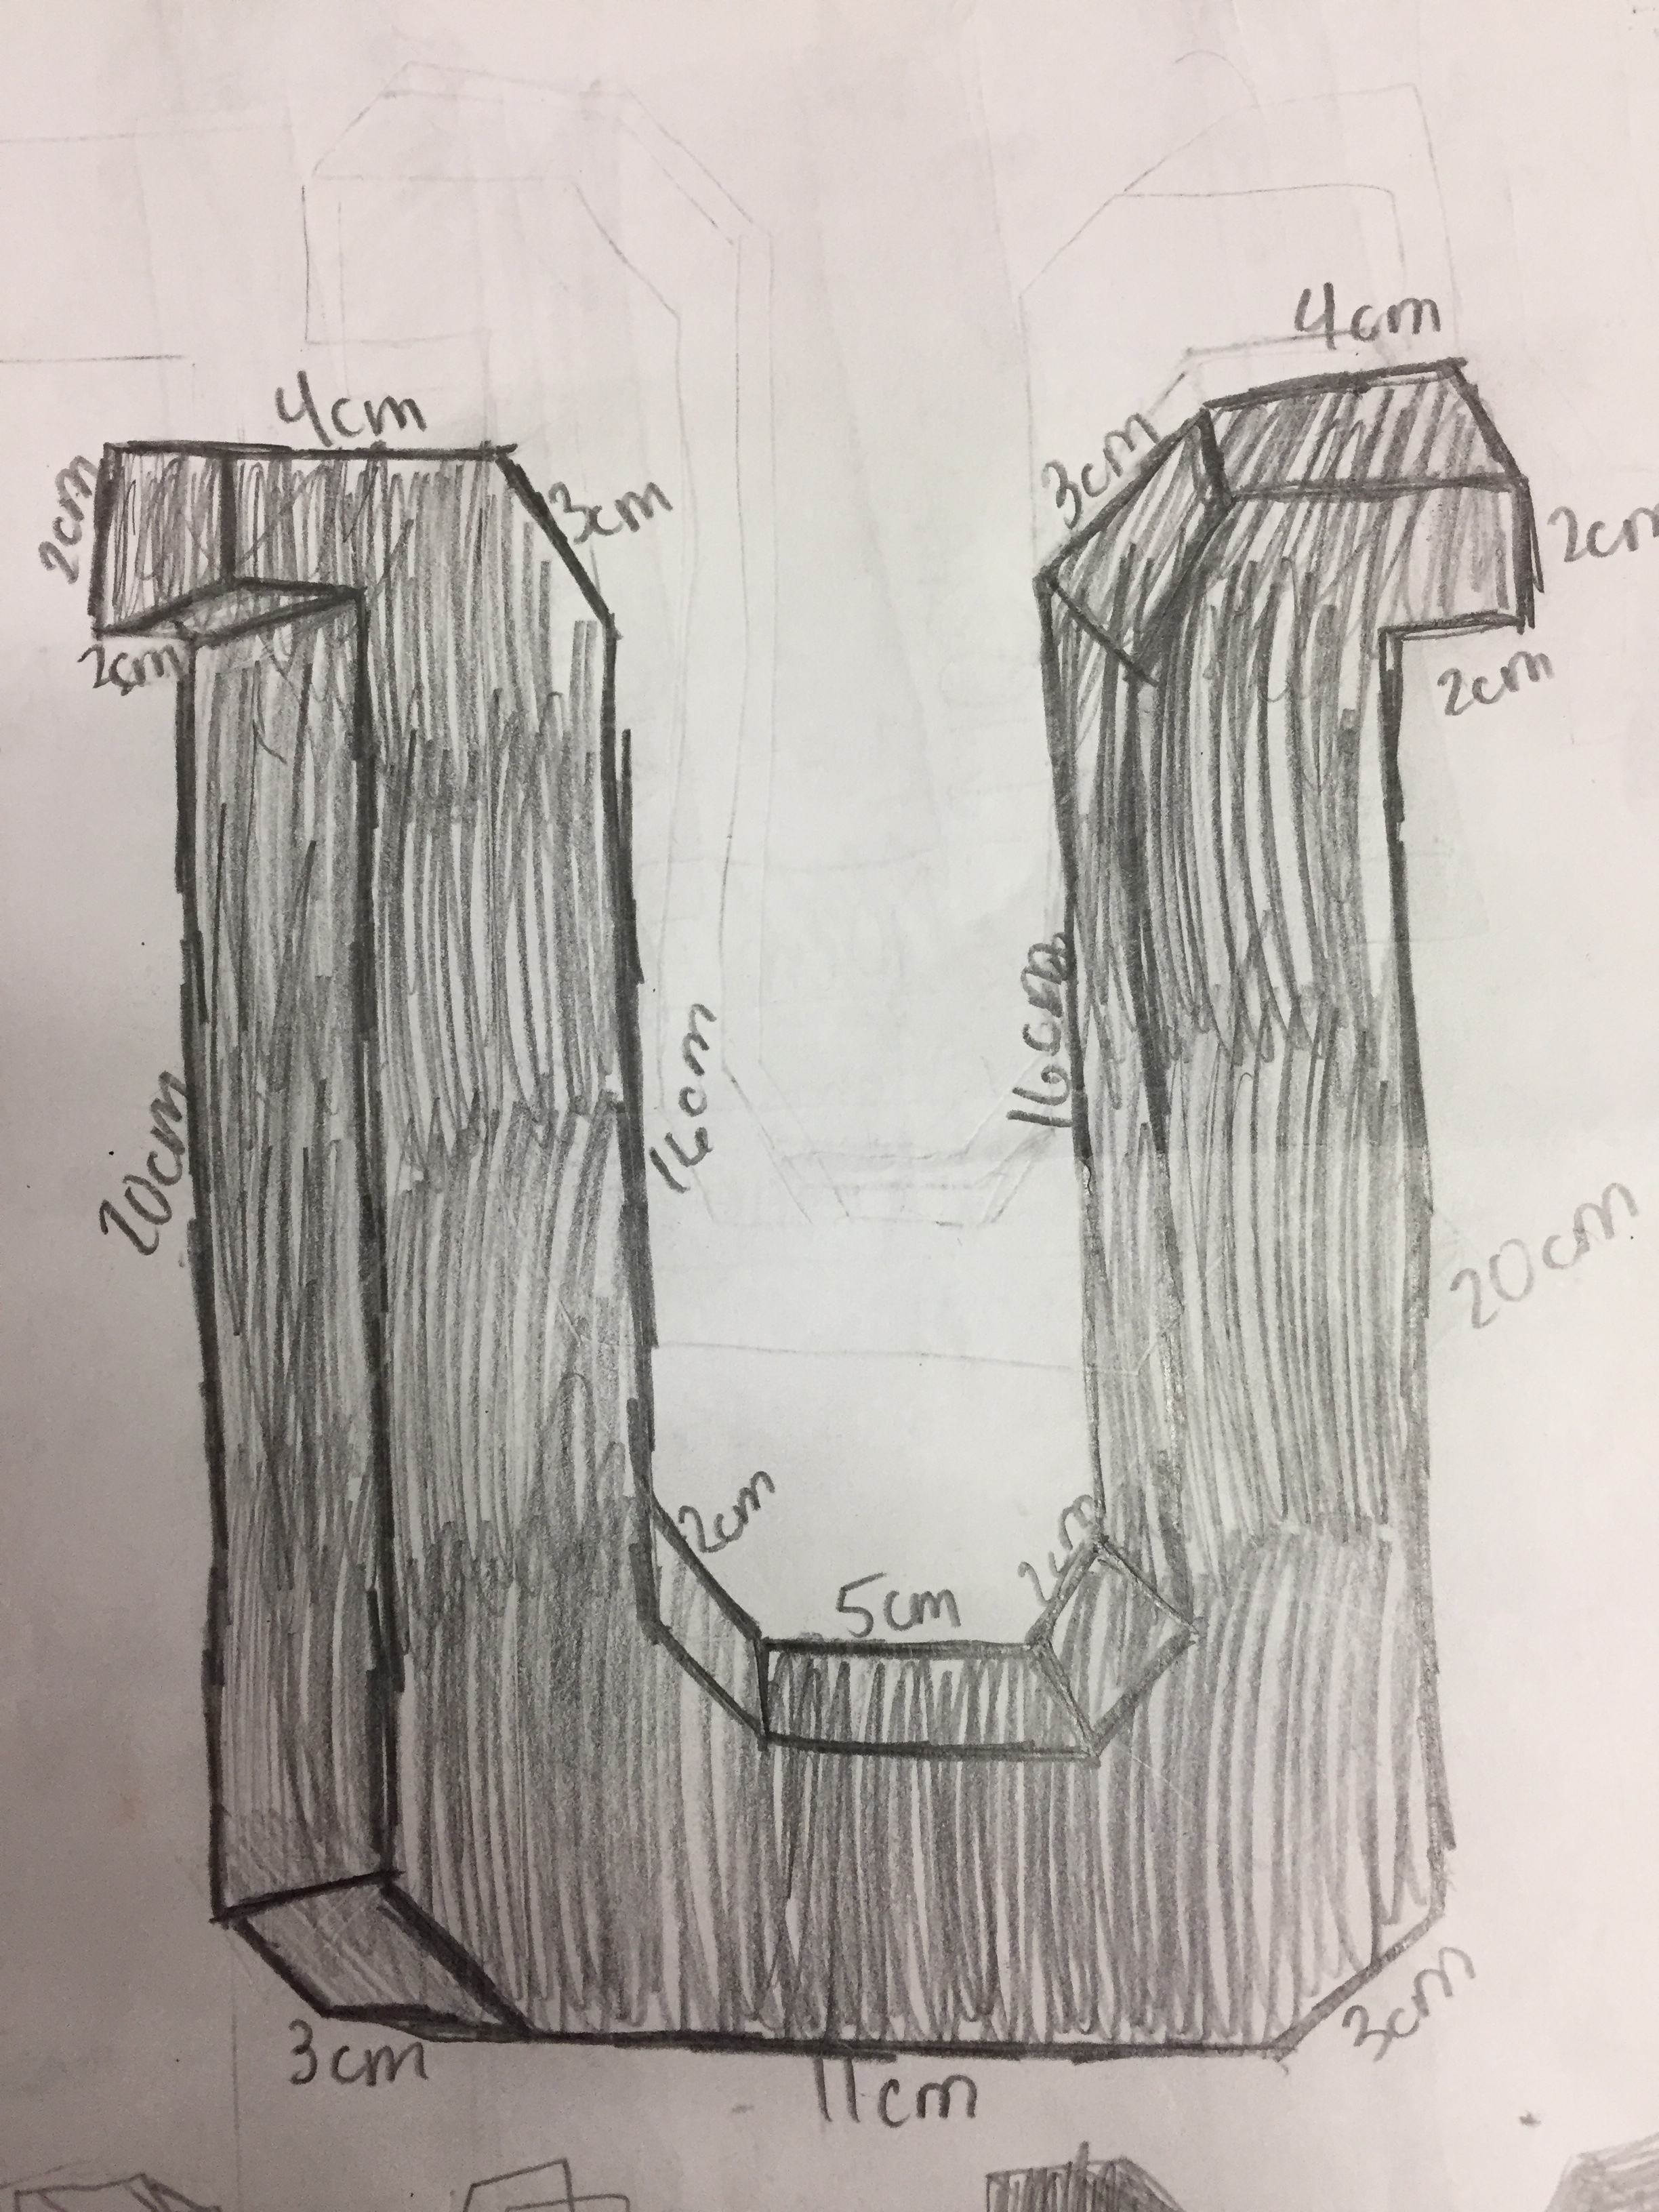
The idea? A light bulb of course. How do you make a light bulb? Make a Hendecagon of naturally.
Like baseball? Really into Star Wars? Love doughnuts?
When coming up with an idea I find it helps student engagement when the students can use a topic that they are interested in. For example, if a student is really into baseball/softball they can make their cereal box look like a glove, bat, baseball field, home plate etc. This year a lot of my students are into the video game Fortnite. As a result, a large amount of cereal boxes has a strong Fortnite theme.
Step 2 - Reverse Engineer
As a middle school or elementary student there are certain limitations that we must work around. Many of these limitations are related to curves. For example, If you are trying to make a basketball (sphere), Football (prolate spheroid), or perhaps a megaphone (truncated cone) you are going to dive into a lot of math that is above middle school math level.
Have the students think about what they want to create and how they can arrange different shapes to make this object. For me, the fun and challenging part of the project is to create these difficult shapes by using the students current knowledge and skills.
Step 3 - Sketch out the idea
Put it down on paper. Draw the different shapes you are going to combine together to create your shape. Include dimensions.
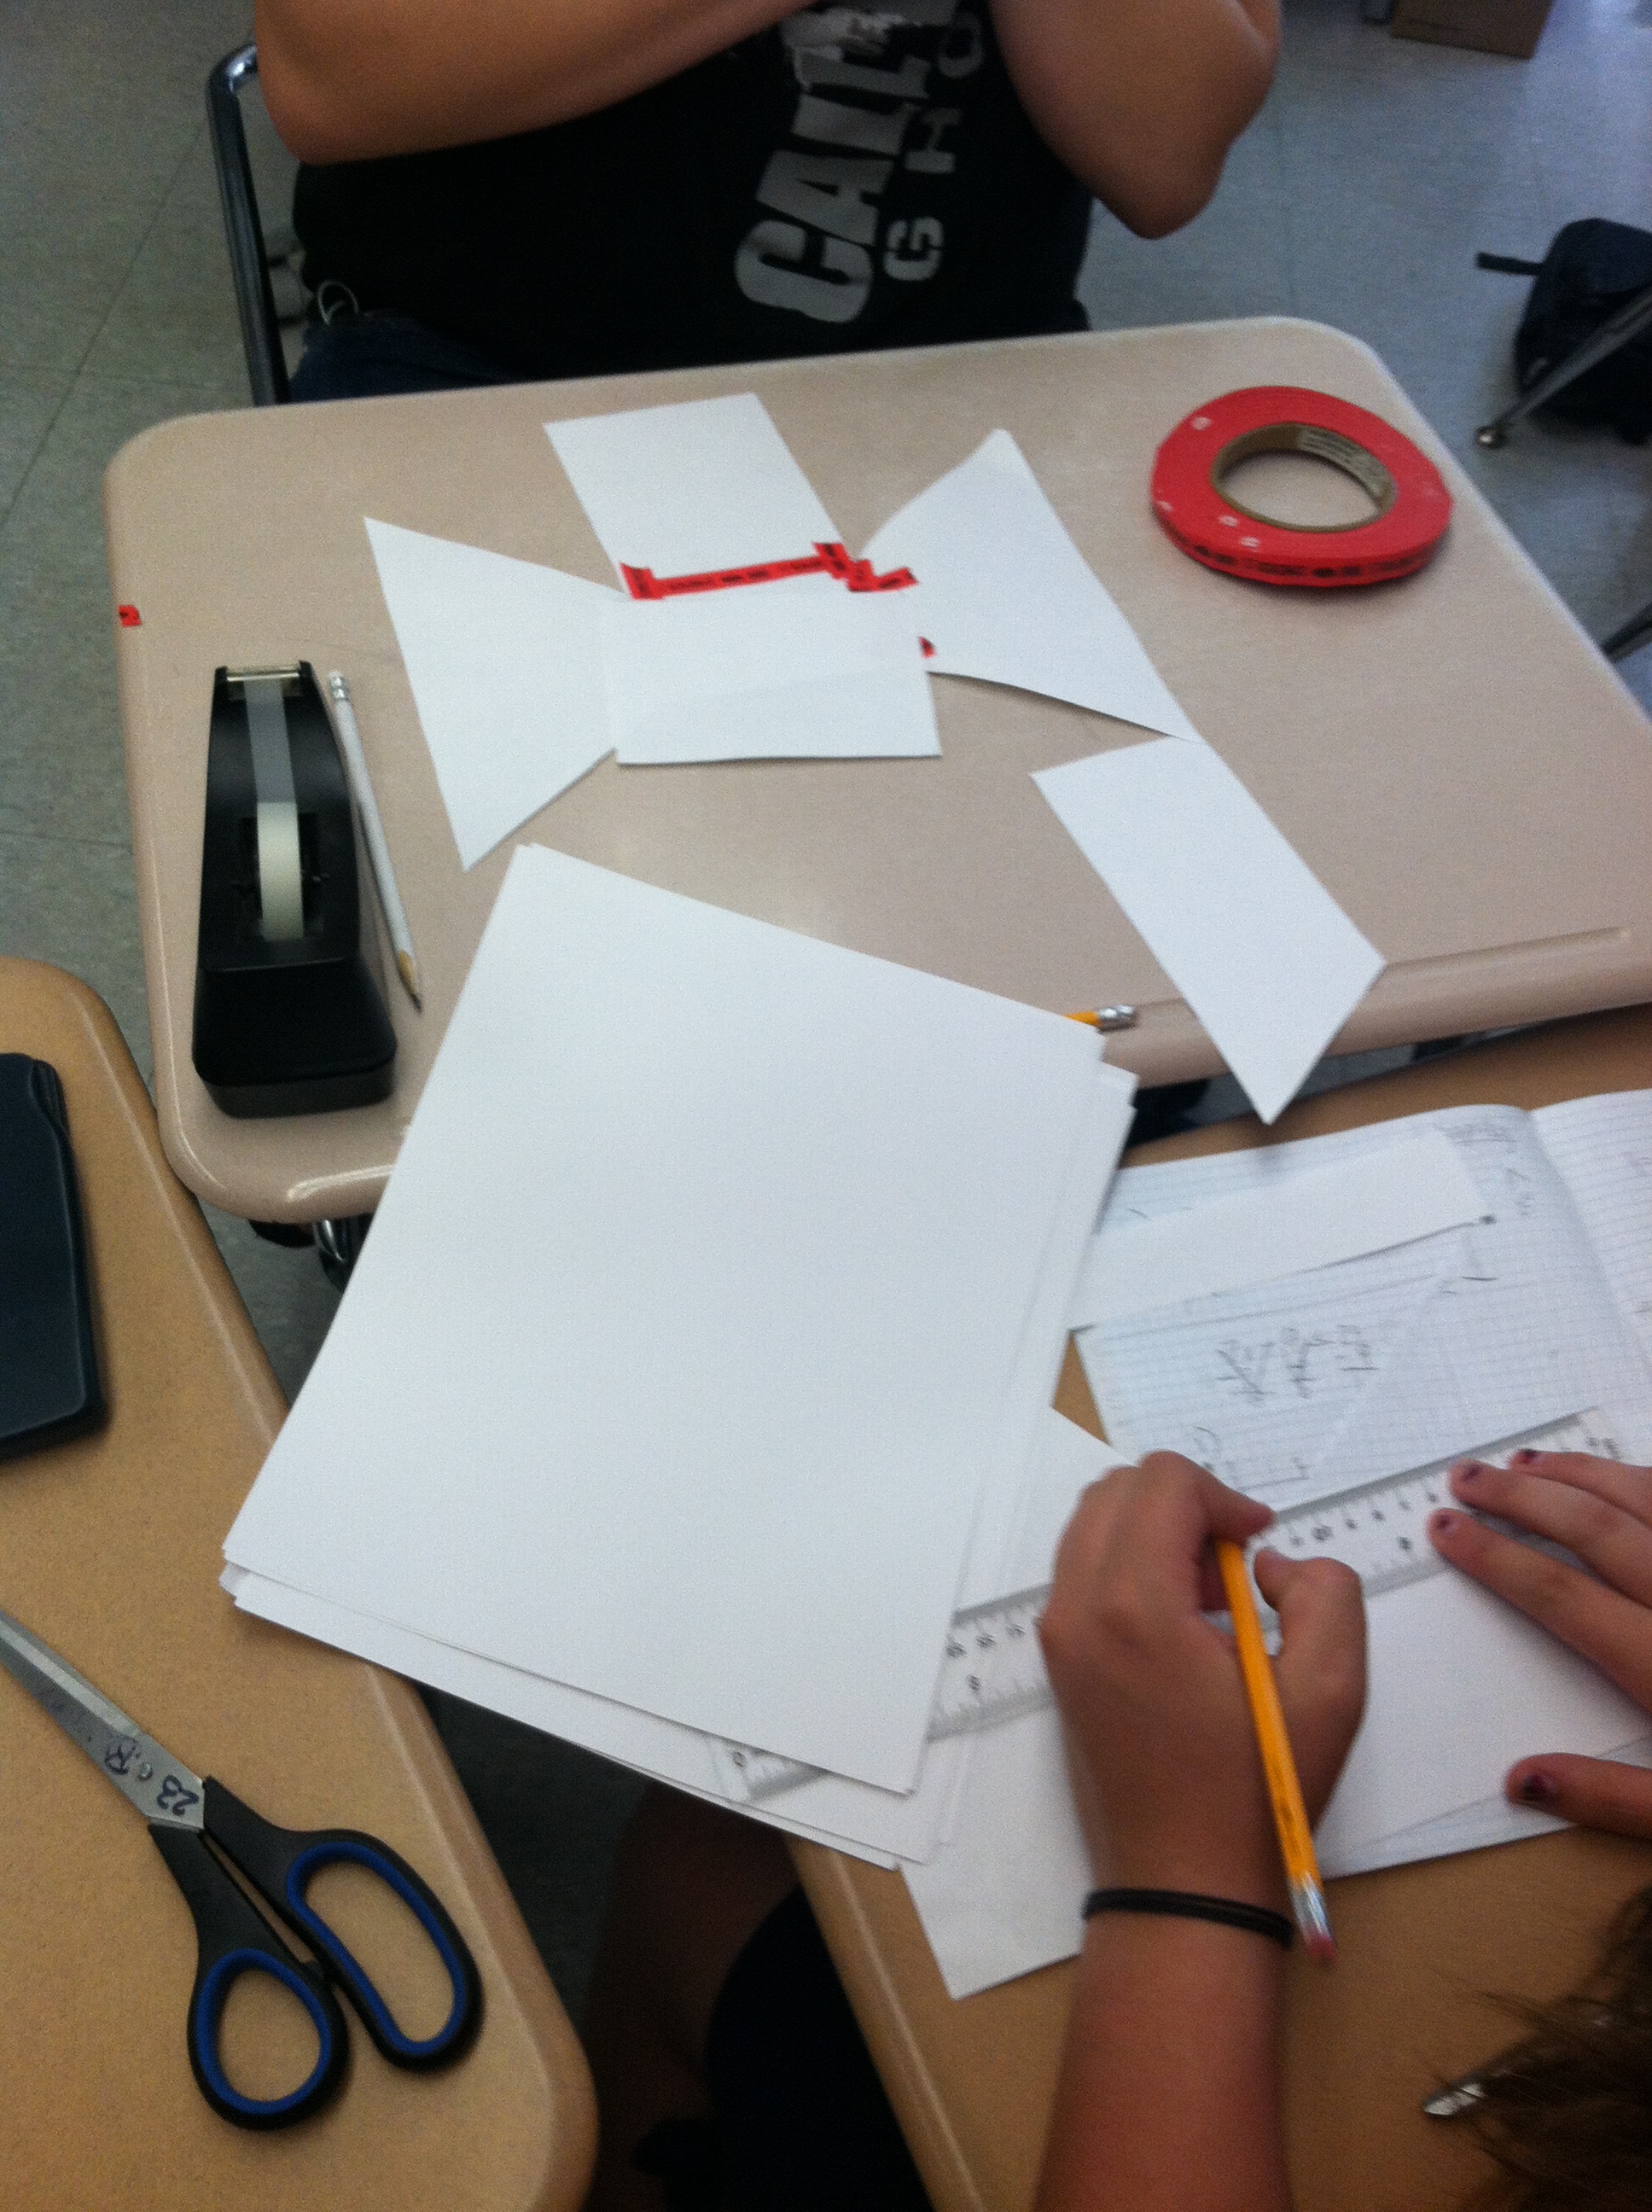
Step 4 - Build a Prototype
I have our students build their prototype the same size as their actual project. We use scrap paper and masking tape to build these prototypes. A lot of potential pitfalls can be avoided during this step.


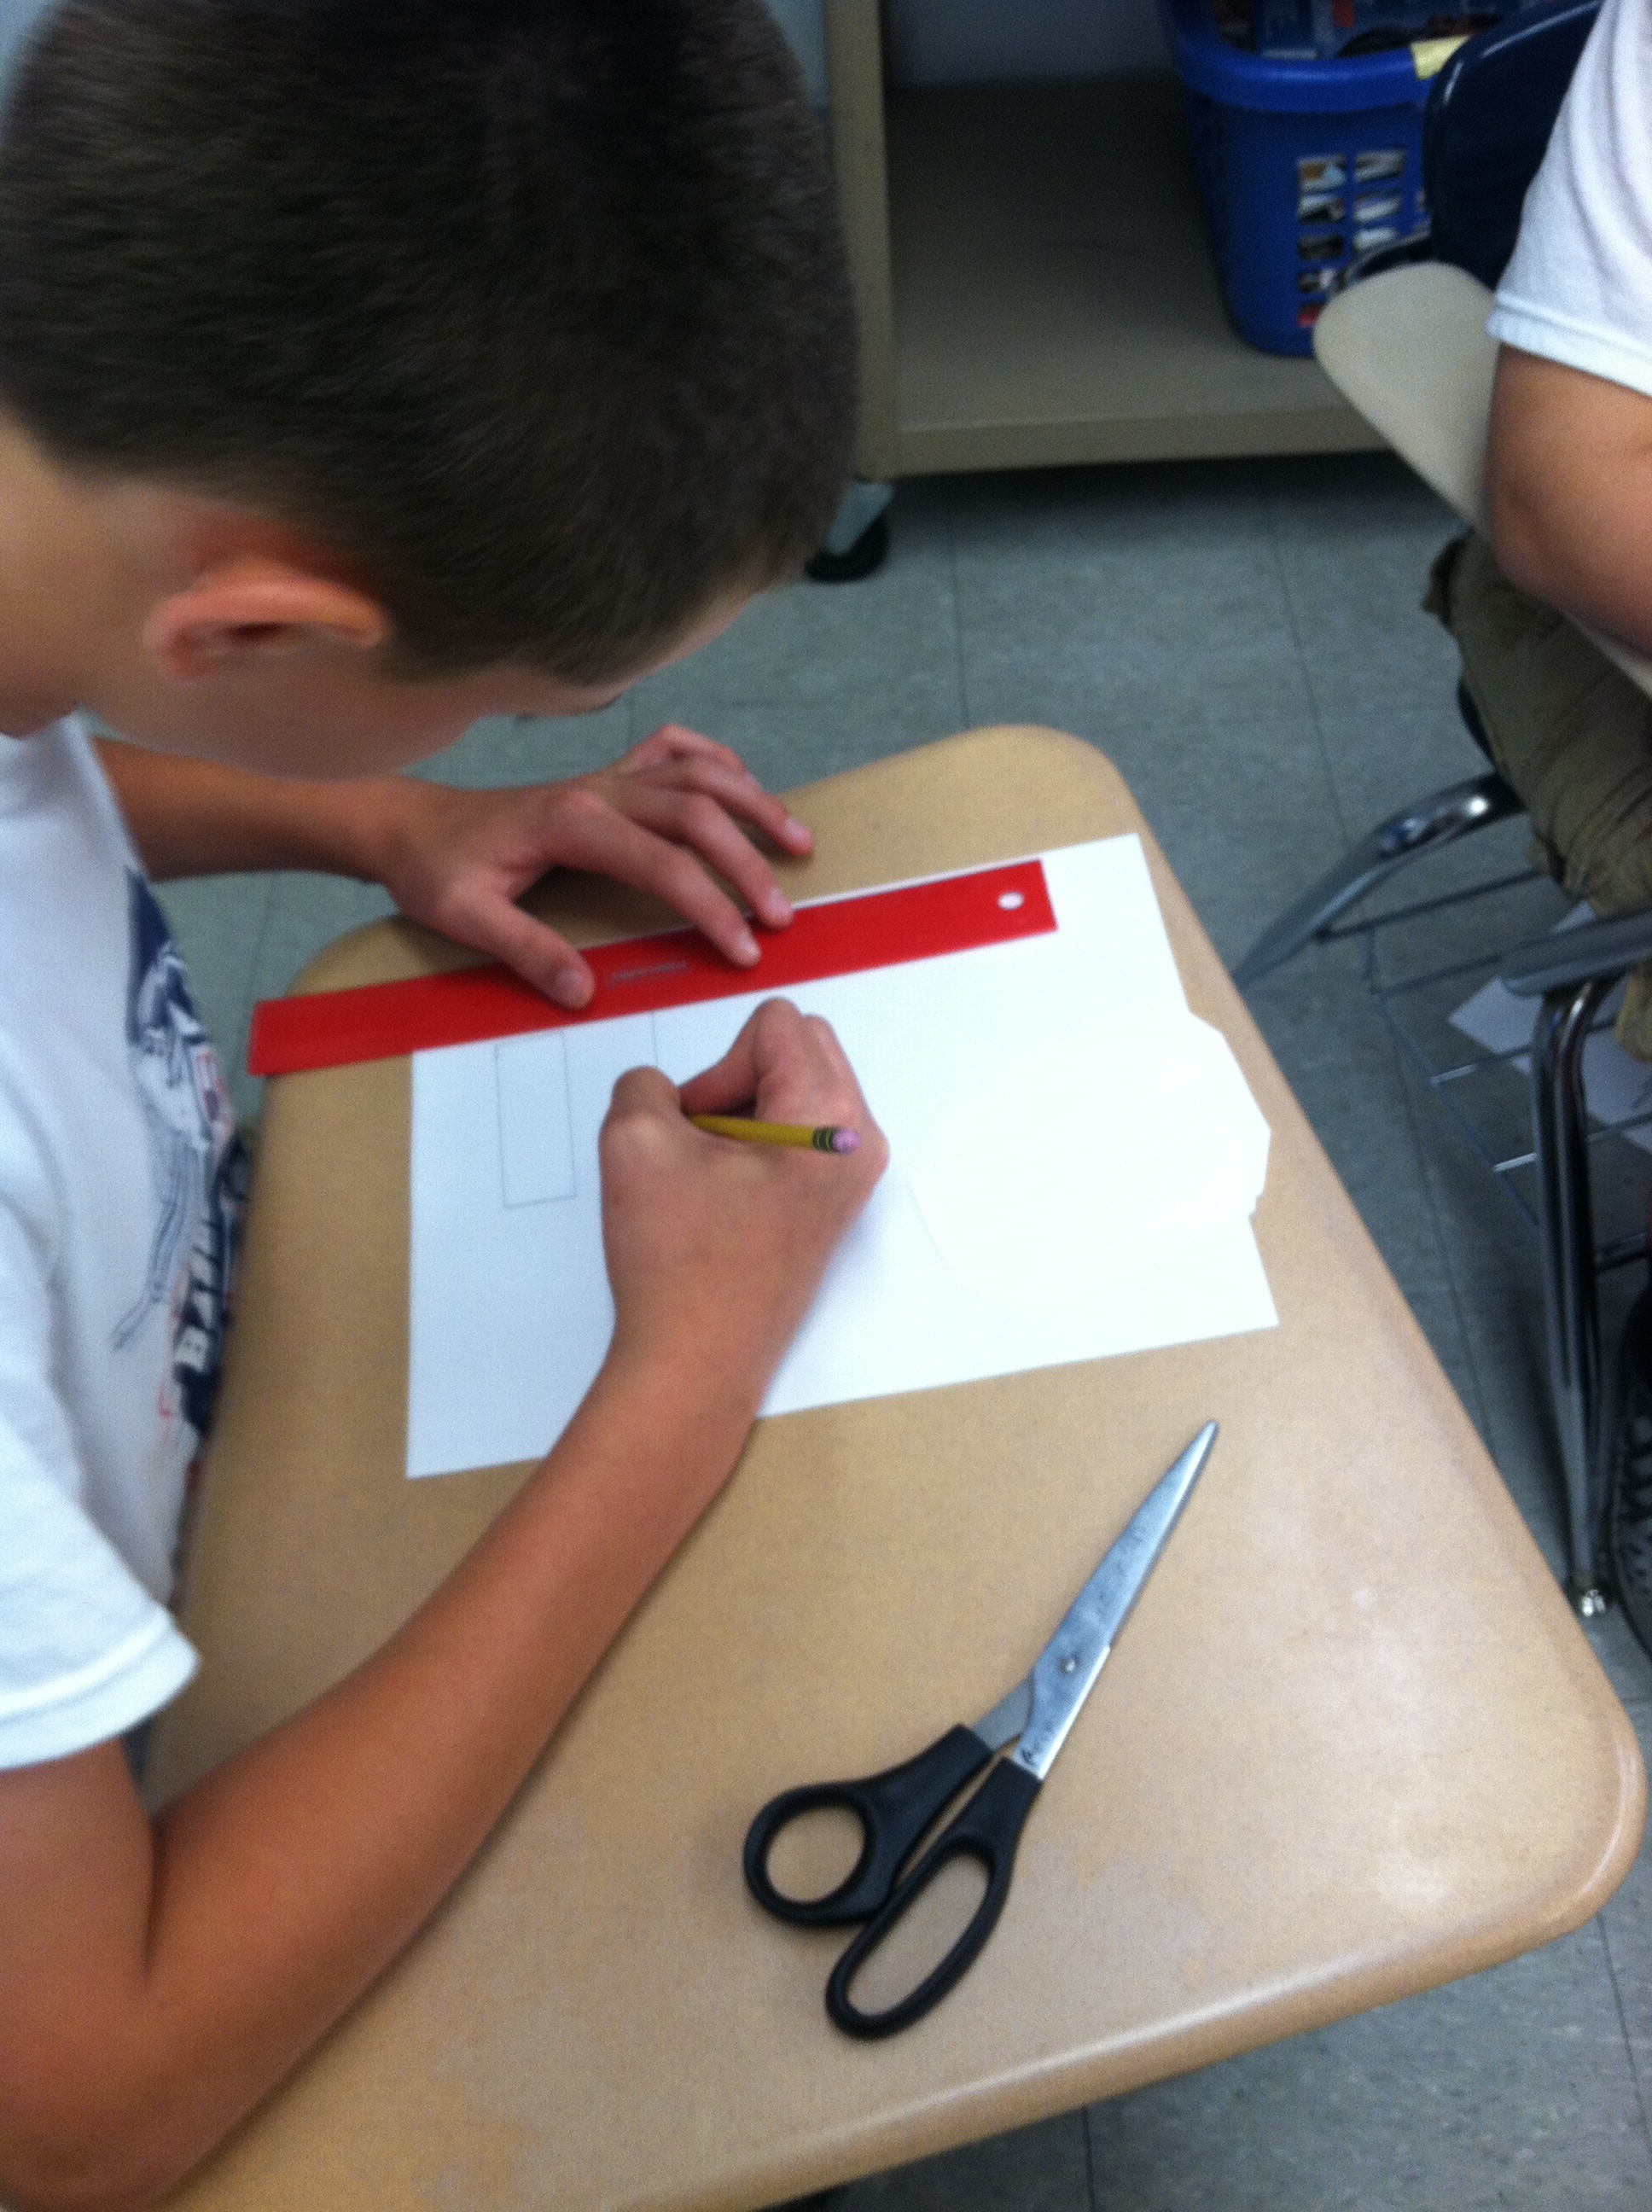
Step 5 - Cutting out individual Pieces
When you begin to build your actual Cereal Box the first thing I like for students to do is cut out the individual sides. We build our cereal boxes out of card stock which is a real thick paper similar to poster board. The thicker paper is nice because it is more stable.
Step 6 - Decorate the individual Pieces
Before the students begin to assemble their projects they should first decorate. Every year I will have a small collection of students that will tape their entire box together then decide to color and design it. This almost always leads to frustration and crushed cereal boxes.


Step 7 - Assemble the Cereal Box
We use scotch tape on the final project. We try to tape as much on the inside as possible. As a general rule: The less tape you see the better the project will look.


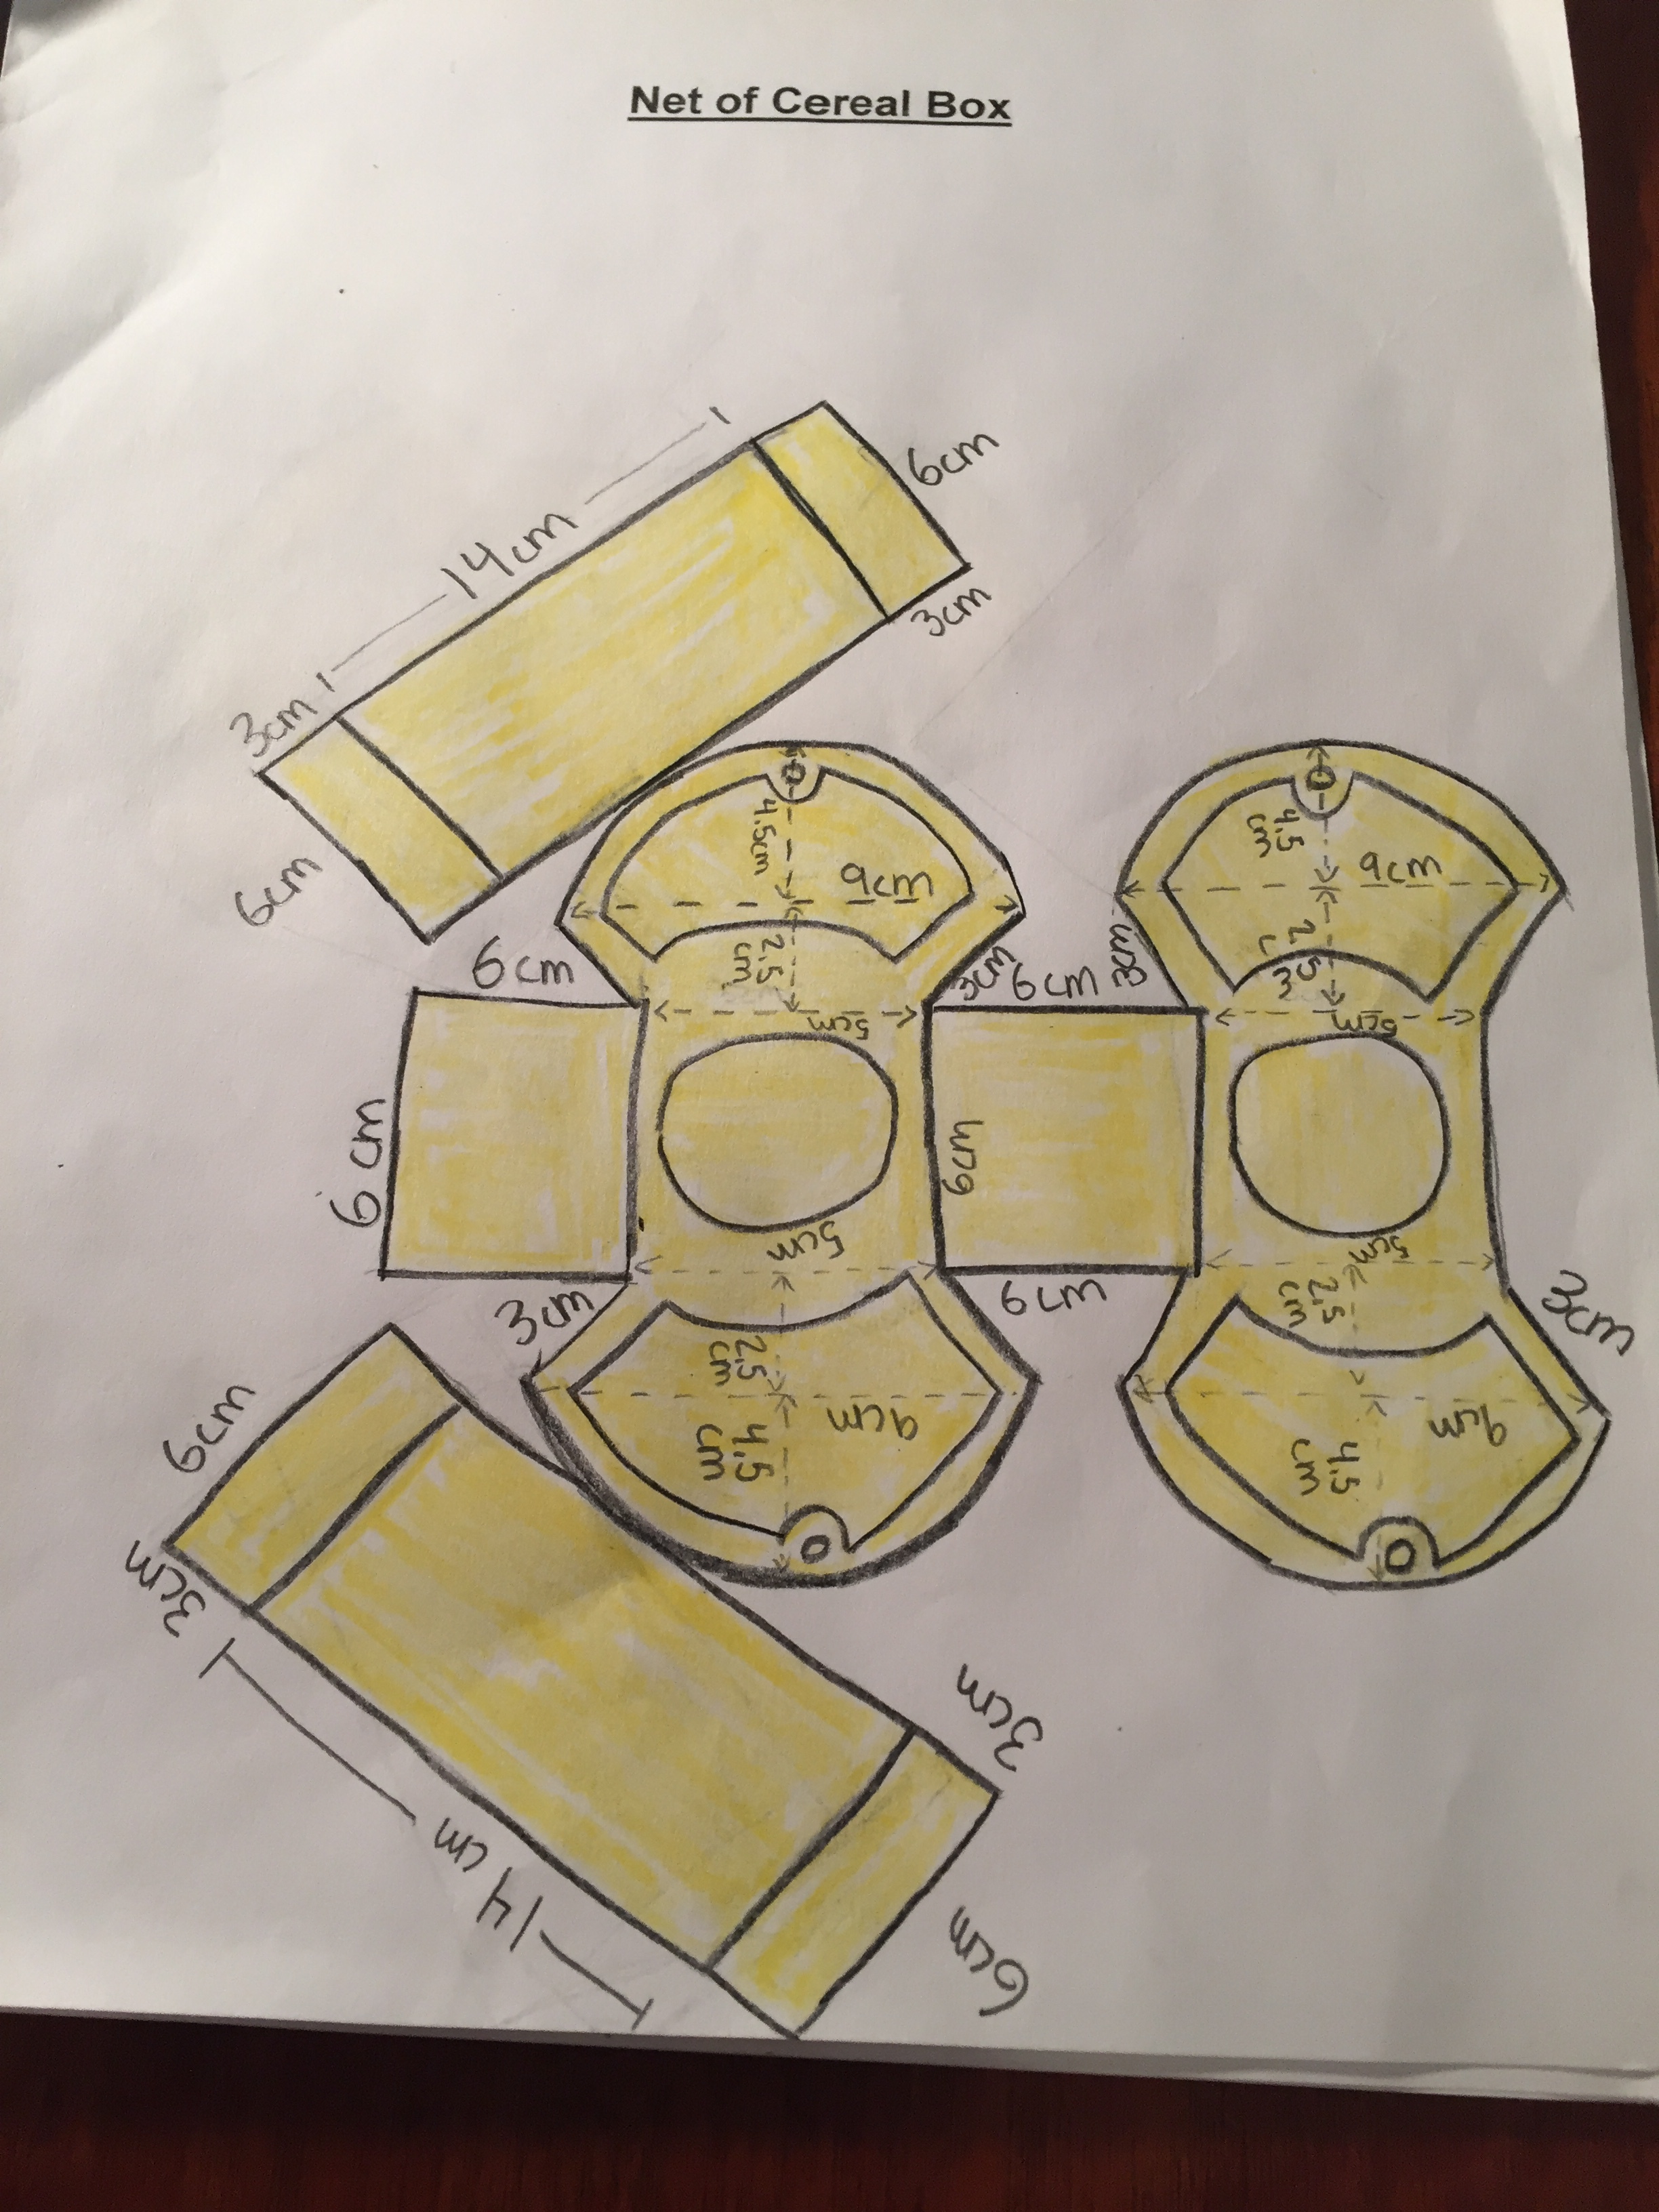
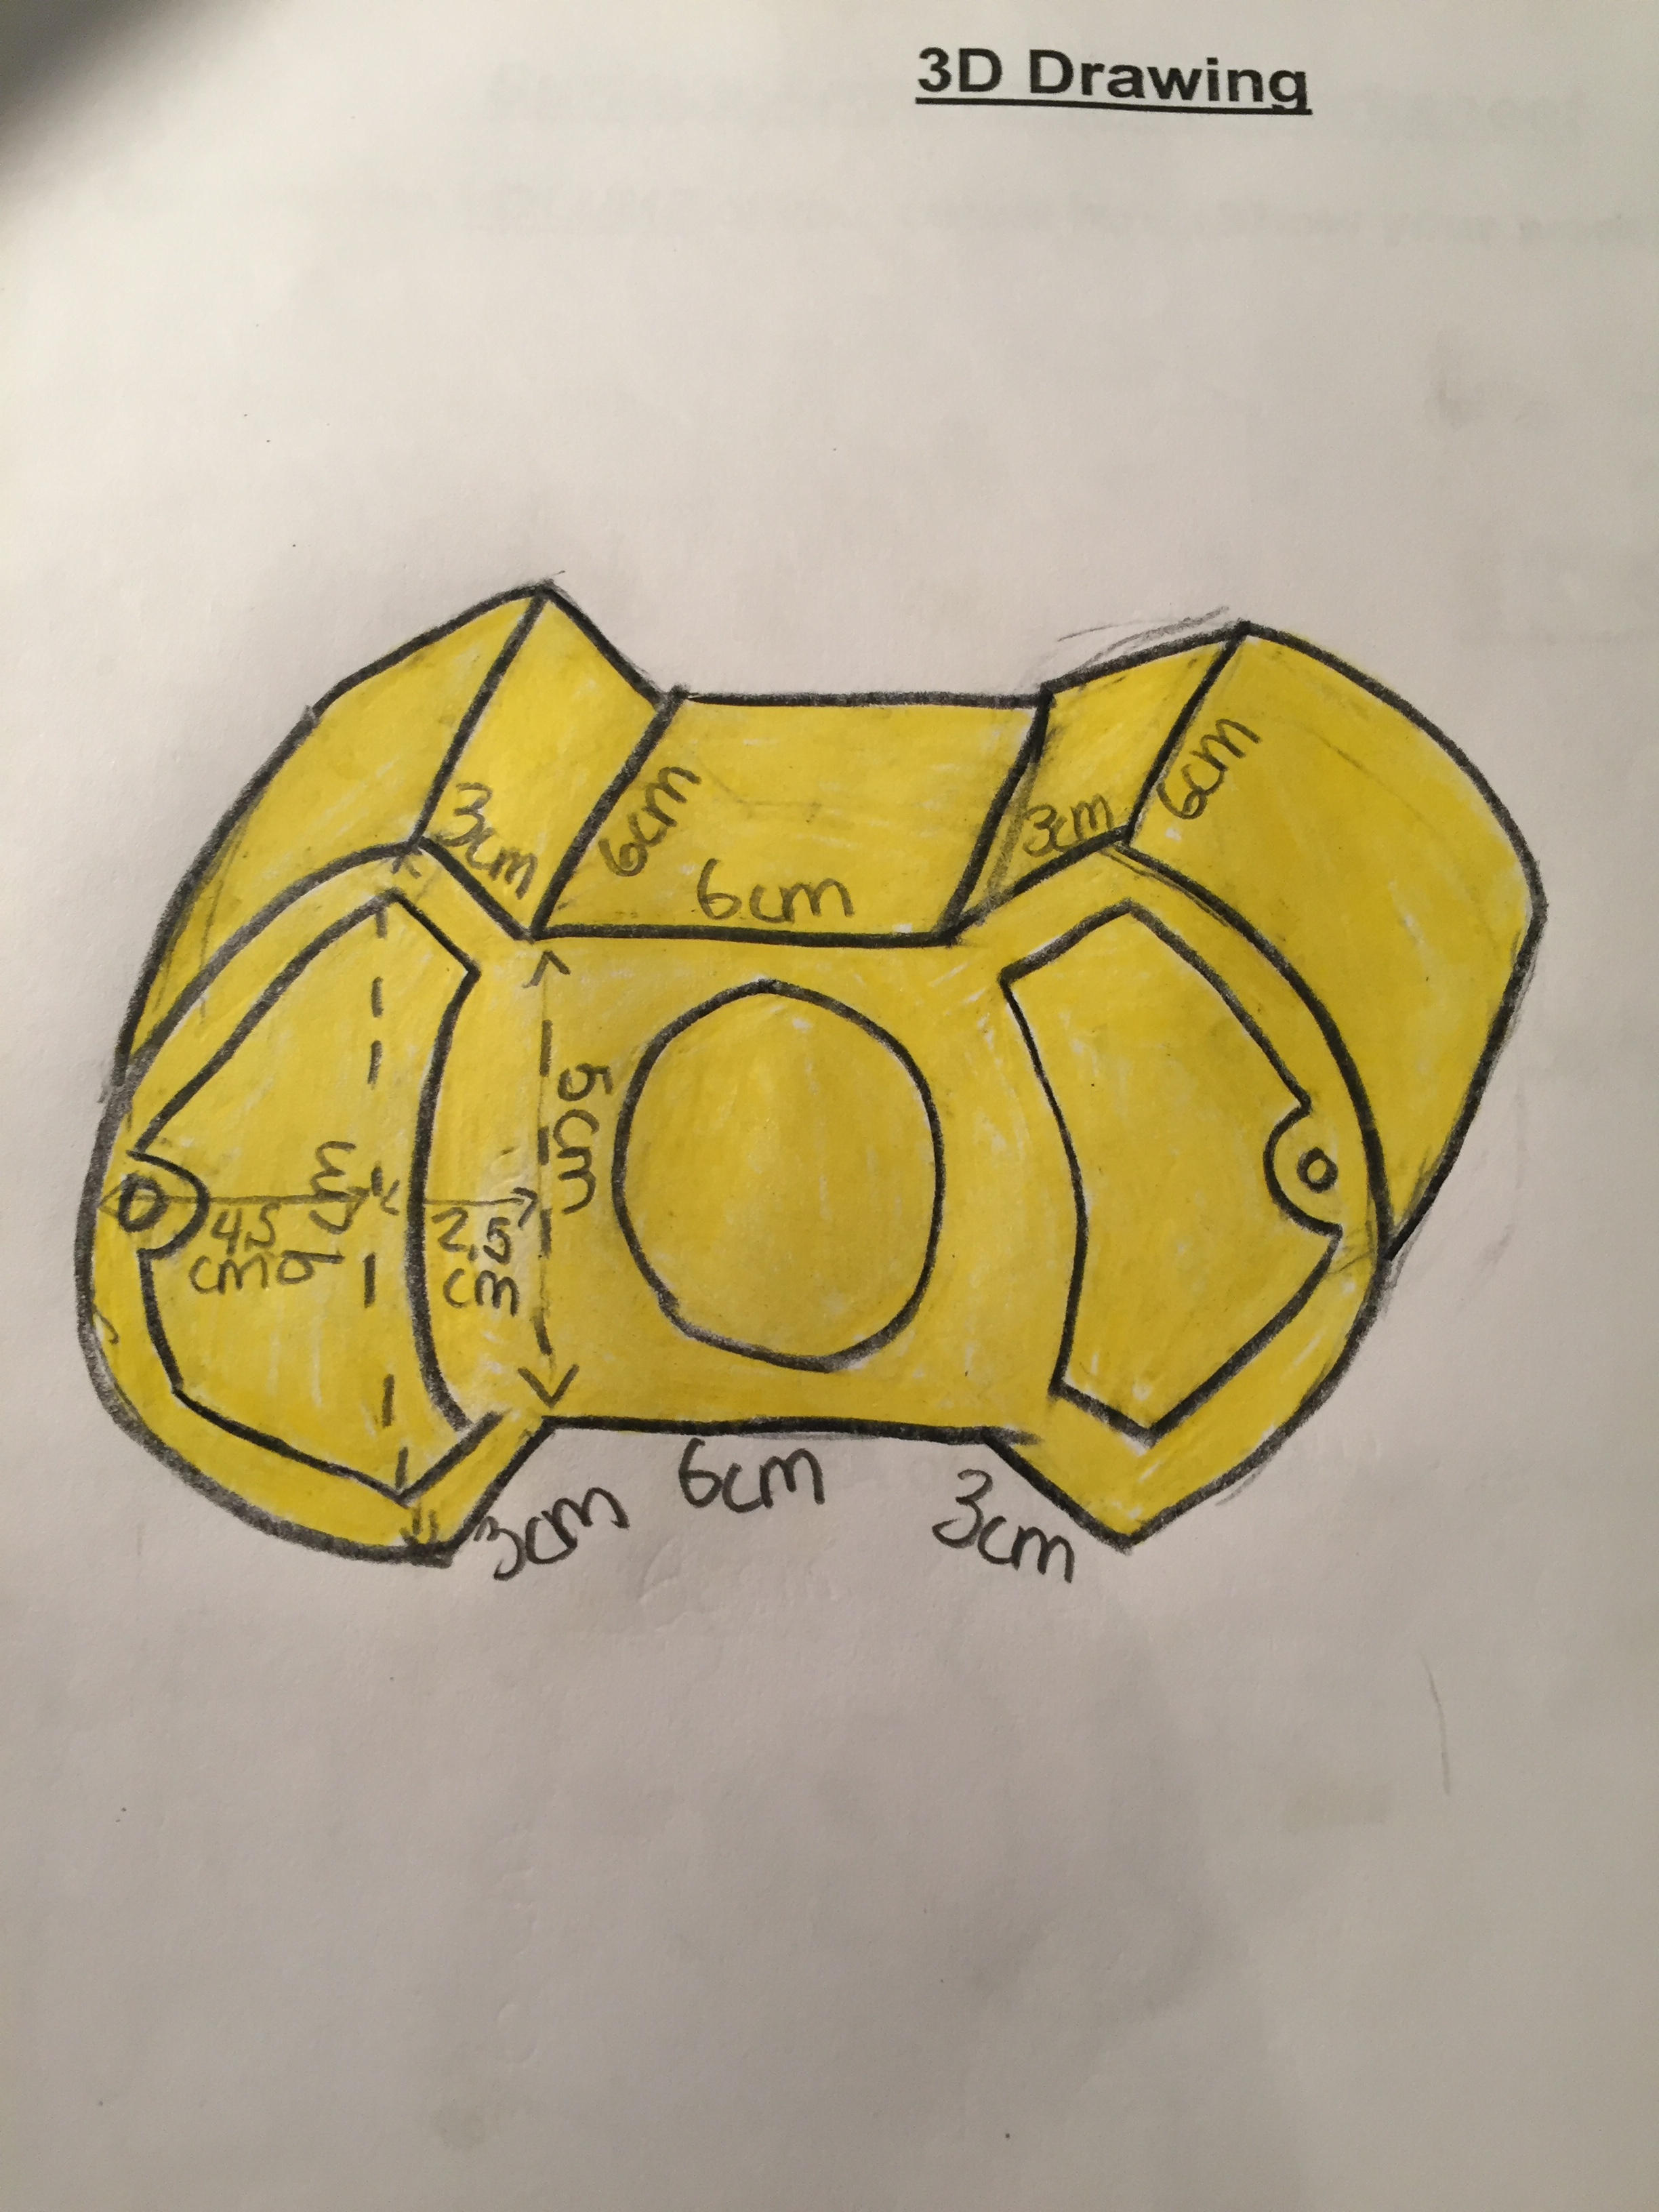
Step 8 - Complete the required paperwork
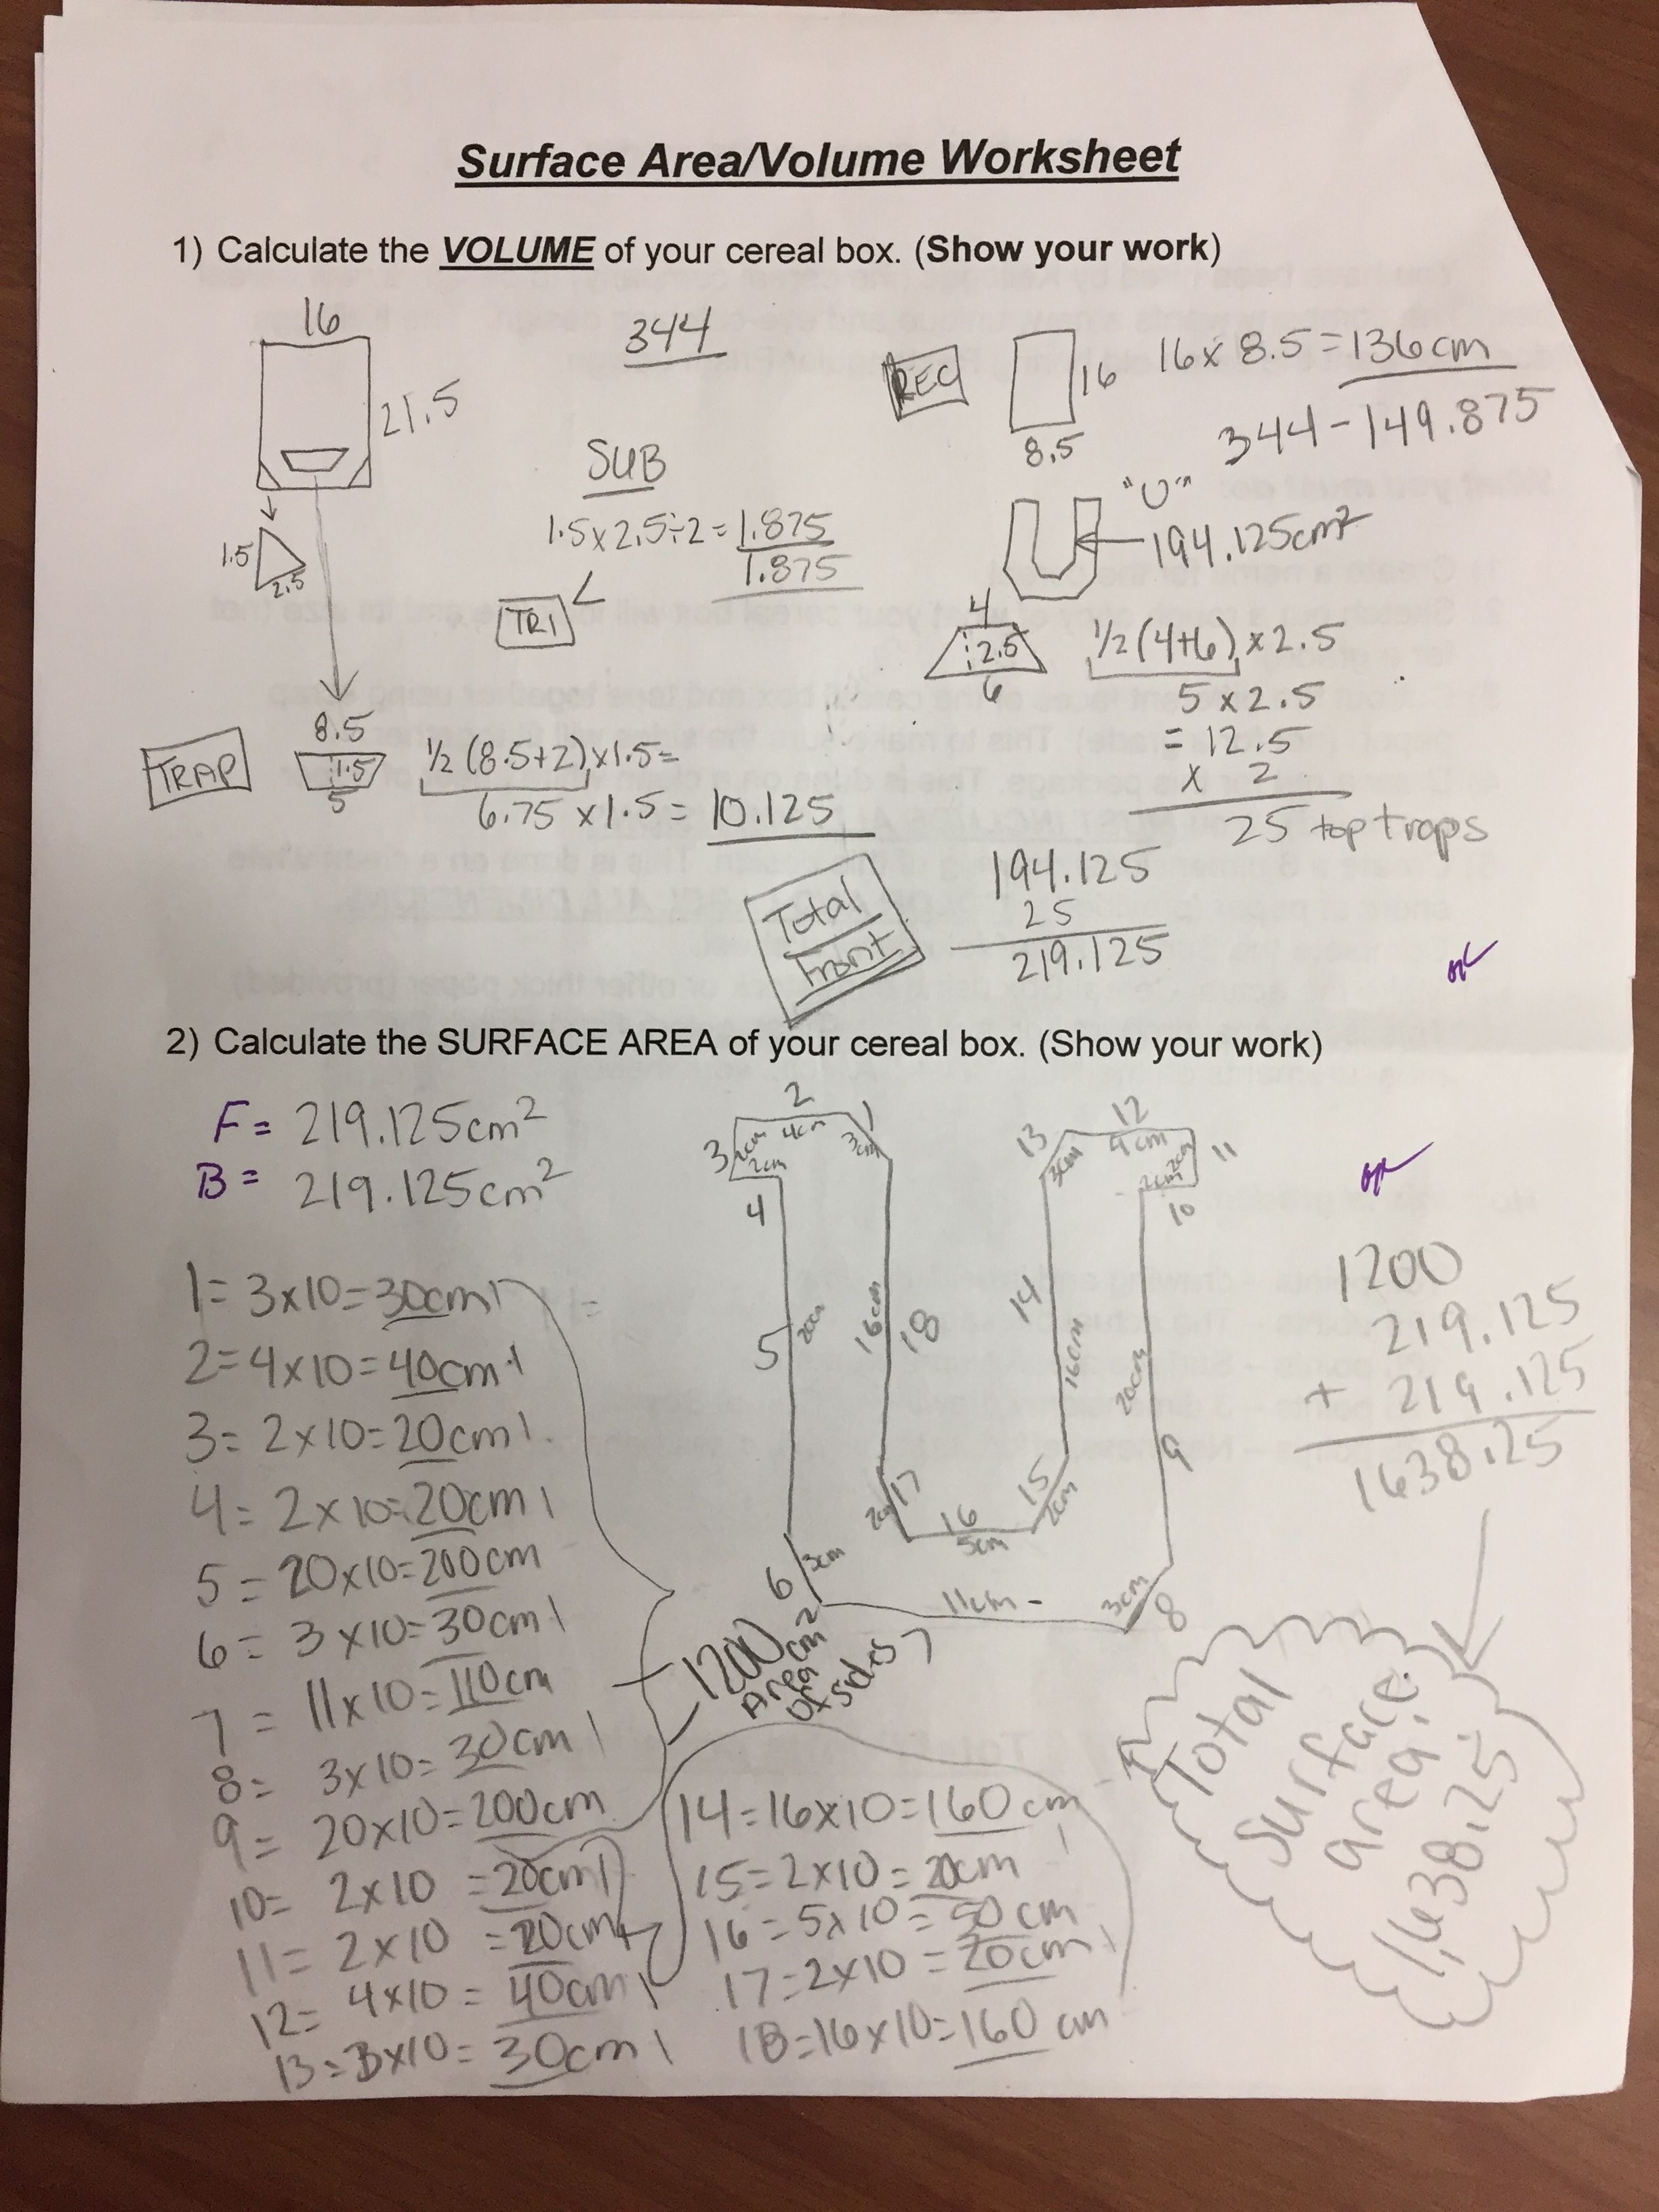
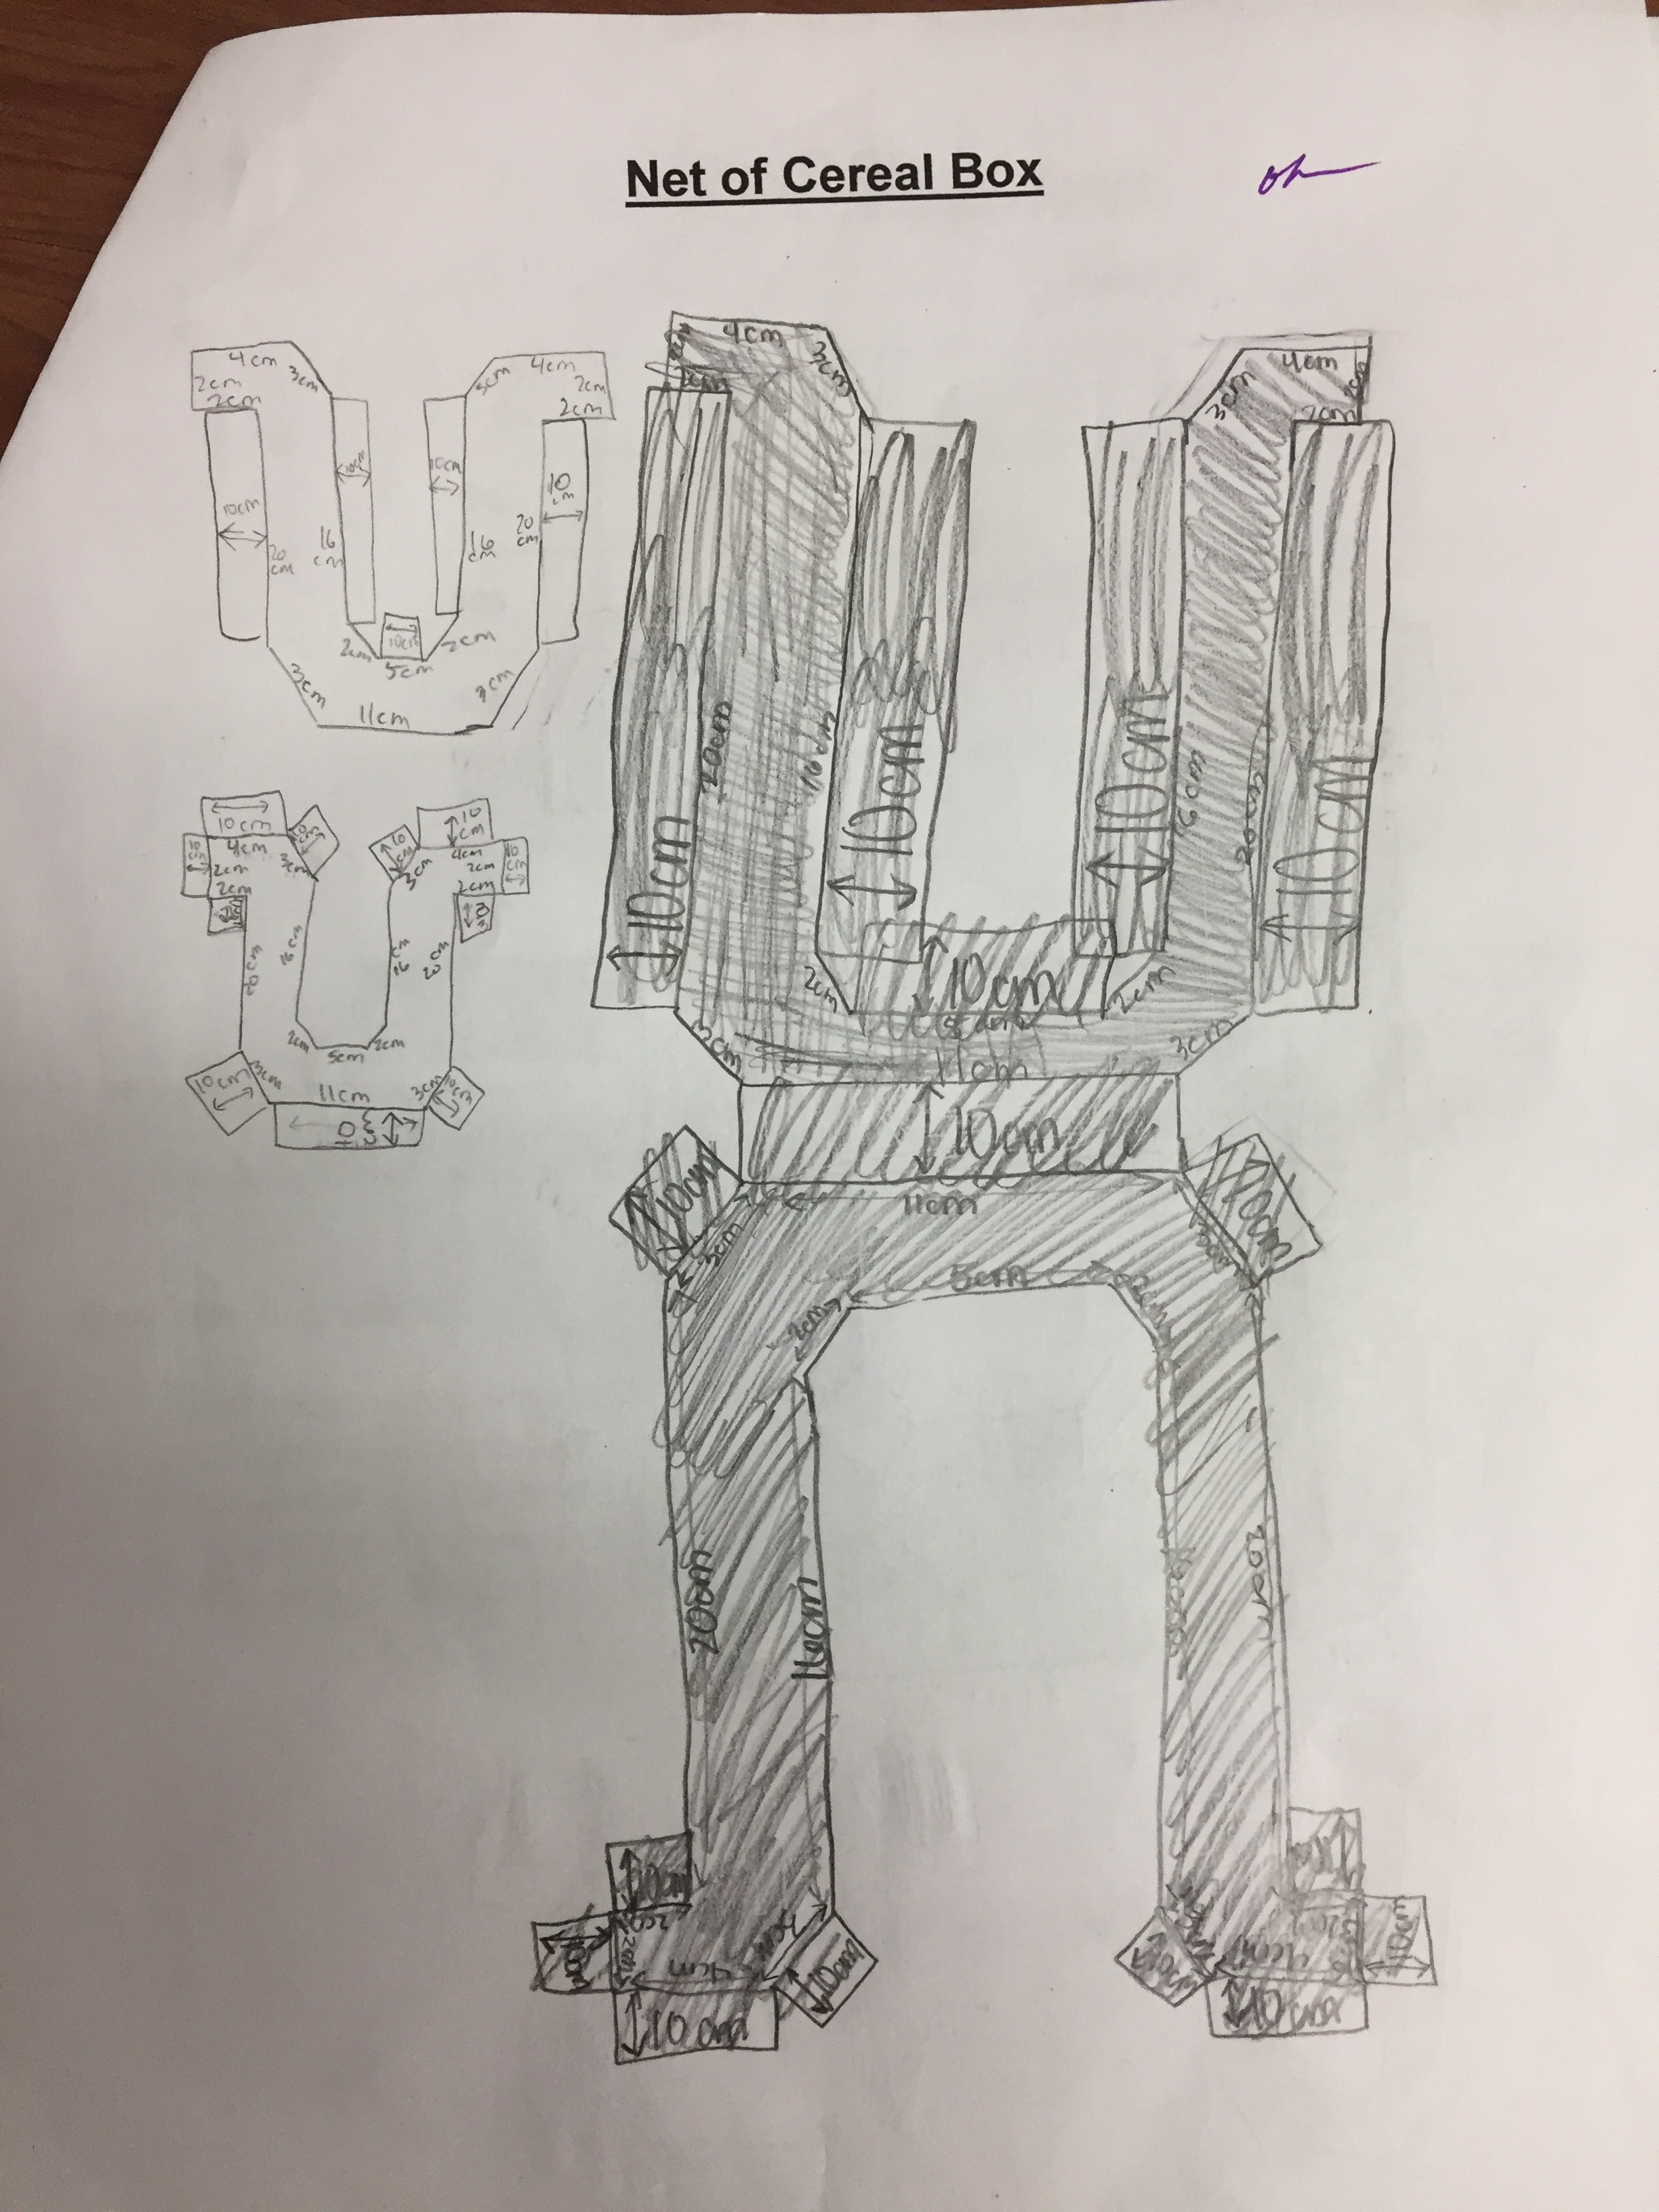
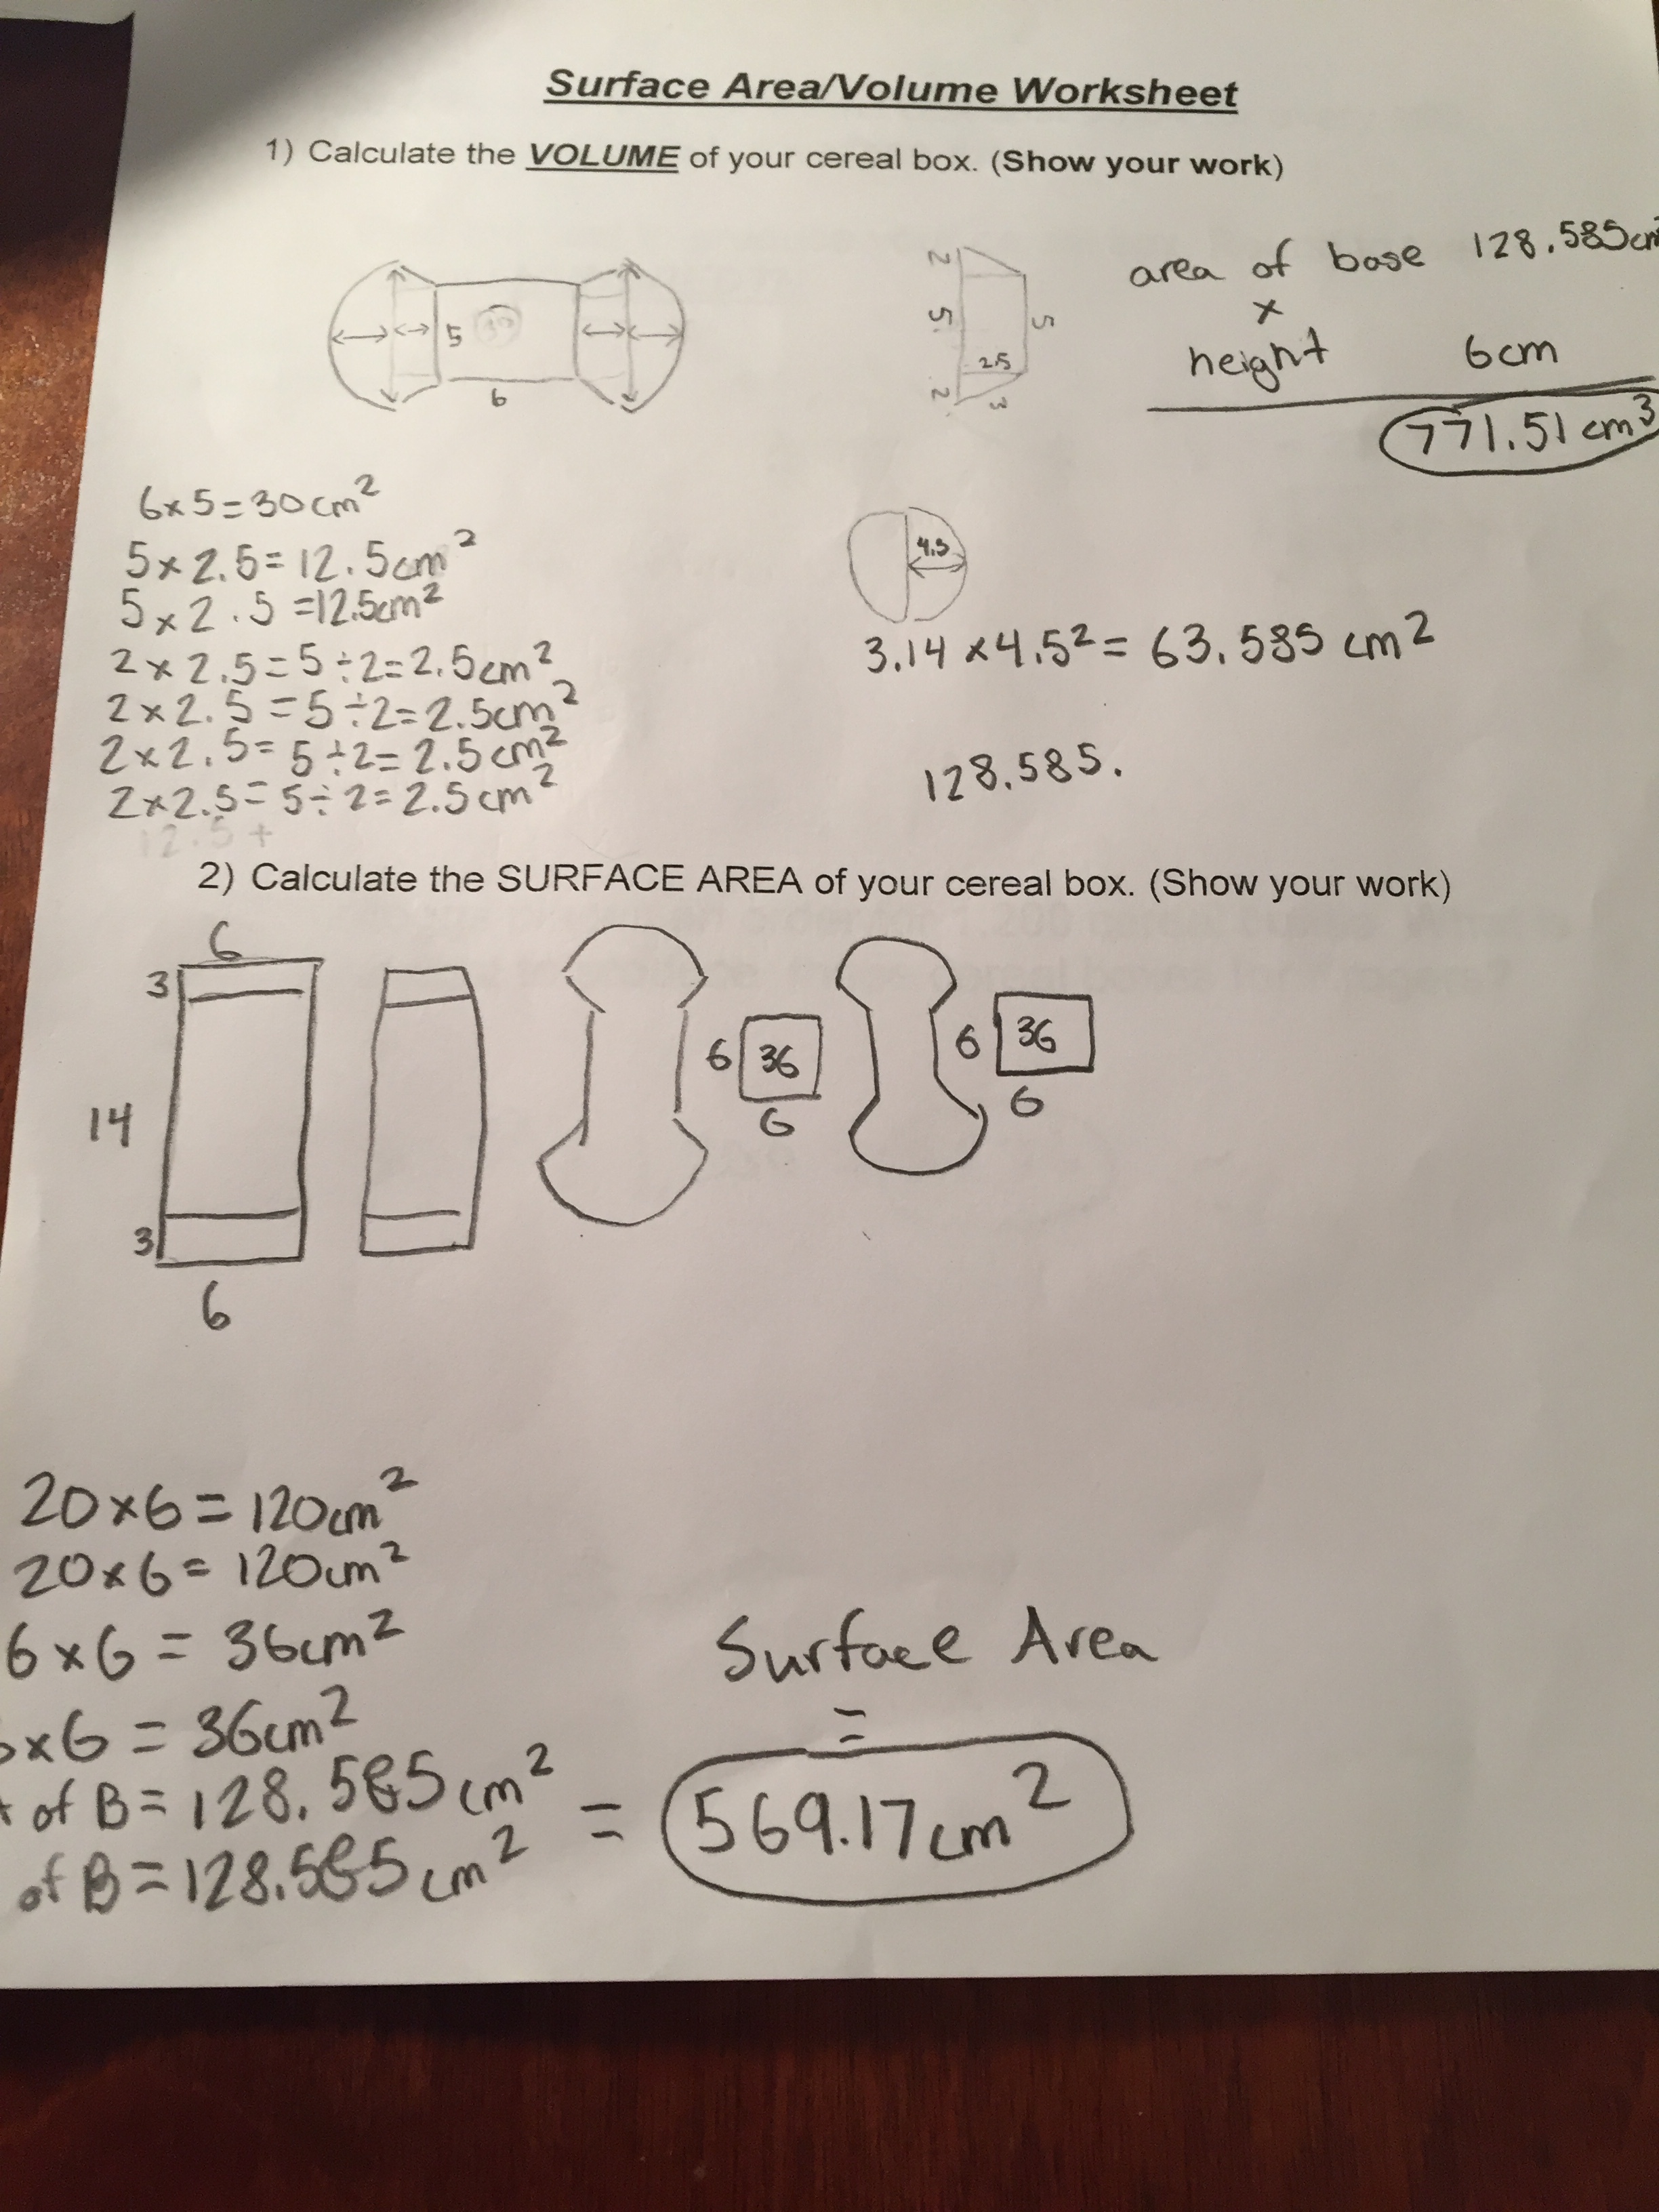
We usually have students calculate the surface area and volume of their projects. In addition we also have students draw (to scale) Nets and 3D designs of the project.
Lessons Learned from this years Cereal Box Projects
We had another successful year with our cereal box project. Many of the projects were creative and well done. Most of the students were fully engaged in the project. But we did have a couple areas that I need to clean up before next year.
The Curse of the Circle
We had a few students this year build cereal boxes that were either cylinders or had a circle as part of the design. In both of these cases many students just randomly made a circle and just wrapped a long stretch of paper around the circle. There was no thought given to diameter, radius, or circumference. Needless to say, this made for a mess when it came time to make the cereal box the same as its prototype and with calculating surface area and volume.
Struggles with Scissors and Straight lines
Normally I will take a day (or two) to show the students a few tips/tricks when making and cutting out the sides of their project. Because of a time crunch this year, I thought I could save a little time and just give a brief talk and turn them lose. In the end this just created a lot more work for me and made it harder to help out as many students.

Interested in giving the Cereal Box Project a try?
This book will give you an in depth guide to how I use this project in my class.

Percentages: How to find the Percent, Part and Whole Amount
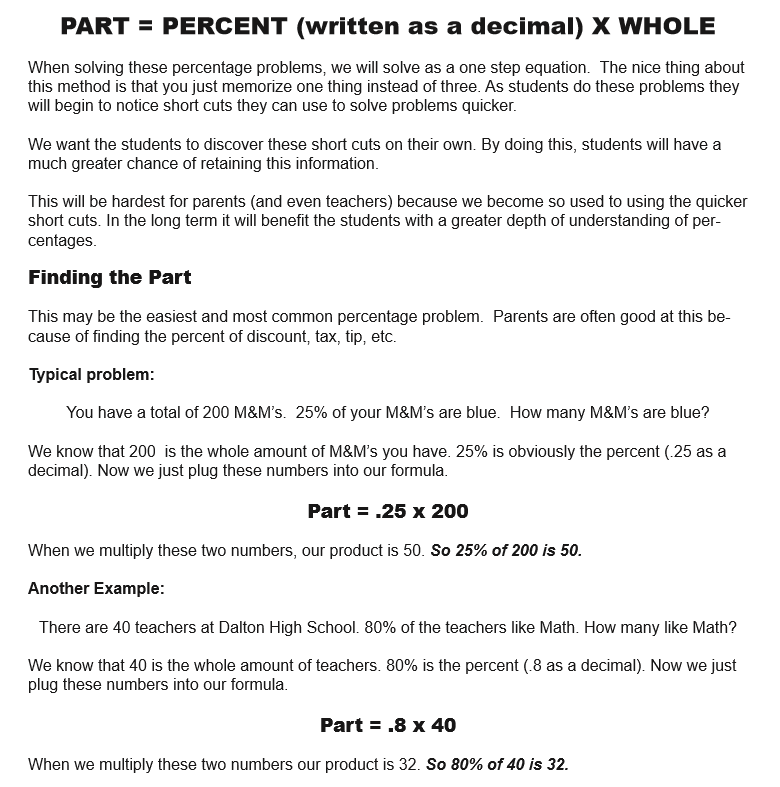
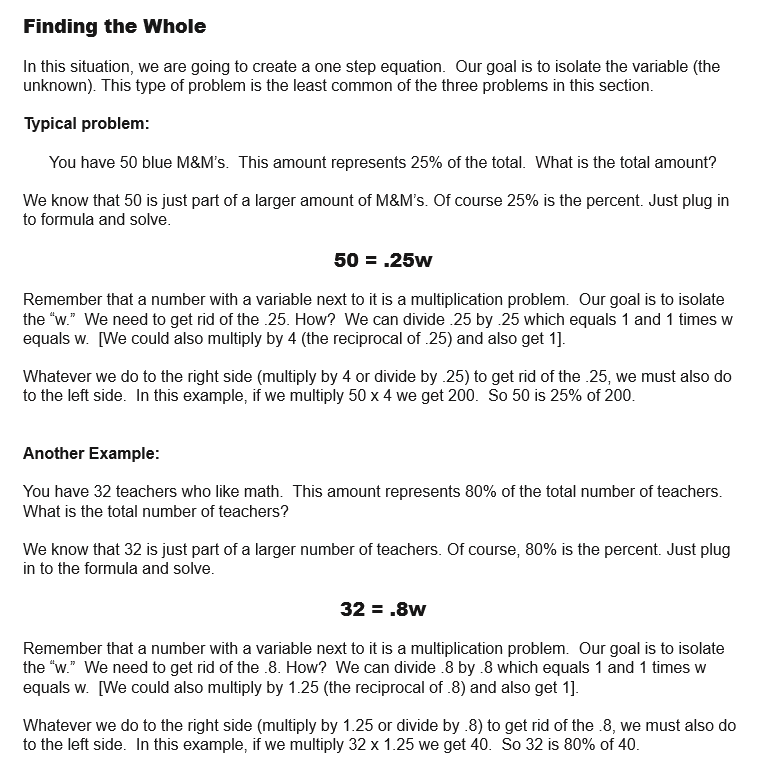
When solving these percentage problems, we will solve as a one step equation. The nice thing about this method is that you just memorize one thing instead of three. As students do these problems they will begin to notice short cuts they can use to solve problems quicker.
We want the students to discover these short cuts on their own. By doing this, students will have a much greater chance of retaining this information.
This will be hardest for parents (and even teachers) because we become so used to using the quicker short cuts. In the long term it will benefit the students with a greater depth of understanding of percentages
Get the Ultimate Guide to Percentages!!
This book is all about percentages (No shock there). It is divided into two parts: Percentage Guide and 30 Printable Percentage Puzzles/Games/Activities. The Guide portion of the book has notes and examples of different situations involving percentages (such as the modeling section above). There is a premium on using an algebraic approach to solving problems in this guide, but different methods are also used.
The following are the sections of this guide: Percentage History Percentage, Fraction, & Decimal Conversion Modeling Percentages Percentages as Ratios Finding the Percentage, Part or Whole amounts Comparing amounts Percentage of Change Percentage of Markup Percentages with Tax and Tips Percentage of Error Simple and Compound Interest Commissions
The Games/Activities/Puzzles section of the book is a combination of 30 different printable puzzles, games and activities. These are all puzzles that I have used with my classes. They are great for station work or just to supplement a percentage lesson.

Cereal Box Project: A middle school math project
For over a decade the Cereal Box Project has been a staple in our classroom. The idea is that a cereal box company is introducing a new cereal and they want a unique design for the cereal box to help gain extra attention.
Because the company wants something creative, a simple rectangular prism simply just won't do. The goal is for students to find ways to combine different shapes together to create this eye catching cereal box.
The following is a basic outline of the steps that we follow with this project. In addition, I'm including a few lessons from this years Cereal Box Project experience.
Step 1 - Come up with an Idea
The idea? A light bulb of course. How do you make a light bulb? Make a Hendecagon of naturally.
Like baseball? Really into Star Wars? Love doughnuts?
When coming up with an idea I find it helps student engagement when the students can use a topic that they are interested in. For example, if a student is really into baseball/softball they can make their cereal box look like a glove, bat, baseball field, home plate etc. This year a lot of my students are into the video game Fortnite. As a result, a large amount of cereal boxes has a strong Fortnite theme.
Step 2 - Reverse Engineer
As a middle school or elementary student there are certain limitations that we must work around. Many of these limitations are related to curves. For example, If you are trying to make a basketball (sphere), Football (prolate spheroid), or perhaps a megaphone (truncated cone) you are going to dive into a lot of math that is above middle school math level.
Have the students think about what they want to create and how they can arrange different shapes to make this object. For me, the fun and challenging part of the project is to create these difficult shapes by using the students current knowledge and skills.
Step 3 - Sketch out the idea
Put it down on paper. Draw the different shapes you are going to combine together to create your shape. Include dimensions.
Step 4 - Build a Prototype
I have our students build their prototype the same size as their actual project. We use scrap paper and masking tape to build these prototypes. A lot of potential pitfalls can be avoided during this step.
Step 5 - Cutting out individual Pieces
When you begin to build your actual Cereal Box the first thing I like for students to do is cut out the individual sides. We build our cereal boxes out of card stock which is a real thick paper similar to poster board. The thicker paper is nice because it is more stable.
Step 6 - Decorate the individual Pieces
Before the students begin to assemble their projects they should first decorate. Every year I will have a small collection of students that will tape their entire box together then decide to color and design it. This almost always leads to frustration and crushed cereal boxes.
Step 7 - Assemble the Cereal Box
We use scotch tape on the final project. We try to tape as much on the inside as possible. As a general rule: The less tape you see the better the project will look.
Step 8 - Complete the required paperwork
We usually have students calculate the surface area and volume of their projects. In addition we also have students draw (to scale) Nets and 3D designs of the project.
Lessons Learned from this years Cereal Box Projects
We had another successful year with our cereal box project. Many of the projects were creative and well done. Most of the students were fully engaged in the project. But we did have a couple areas that I need to clean up before next year.
The Curse of the Circle
We had a few students this year build cereal boxes that were either cylinders or had a circle as part of the design. In both of these cases many students just randomly made a circle and just wrapped a long stretch of paper around the circle. There was no thought given to diameter, radius, or circumference. Needless to say, this made for a mess when it came time to make the cereal box the same as its prototype and with calculating surface area and volume.
Struggles with Scissors and Straight lines
Normally I will take a day (or two) to show the students a few tips/tricks when making and cutting out the sides of their project. Because of a time crunch this year, I thought I could save a little time and just give a brief talk and turn them lose. In the end this just created a lot more work for me and made it harder to help out as many students.
Interested in giving the Cereal Box Project a try?
This book will give you an in depth guide to how I use this project in my class.

Making 3D Shapes and Similar Objects using Scale Drawing
Creating 3 Dimensional Drawings
One of my favorite activities each year is using scale factor to create three dimensional drawings. We do this activity when we are studying Unit Rates. There are a variety of reasons why this is one of my go to lessons.
Hands On
This activity gives students the chance to create something. The act of drawing, measuring, & designing is a nice change of pace from the usual worksheet avalanche. The actual act of creating this object allows students to see the relationship of sides all changing proportionally.
Creativity
This lesson gives students the opportunity to showcase their creative/artistic side. We have some basic guidelines, but in general students are free to design what appeals to them.
Visual
Many students are visual learners. For some students it easy to see difference between an object drawn to scale and an object that does not have a constant proportionality.
Connections with other classes
Art, Social studies (maps), industrial tech, and computer science classes are some of the classes that we are able to show a connection with. For example, our art classes use one point perspective drawings which share a ton of similarities with our scale drawings.
Differentiate
The activity allows you to increase (or decrease) the difficulty. For example, if you have a student that is struggling you can use a very simple shape such as the letter "L" or use a very easy scale factor such as 2. If you want to increase the intensity you can have students measure everything in inches (not centimeters) or require a very unusual scale factor such as 3/8 or 1.75.
THE PROCESS
The Build Up
One of the first things we do is to talk about Scale Factor. We want the students to understand that when we are enlarging (or shrinking) an object all the edges of this object are increasing (or decreasing) at a constant rate (proportion). We do this by having a worksheet with similar objects and their measurements. Students will then find the rate of increase or decrease (Scale Factors less than one = smaller, greater than one = larger).
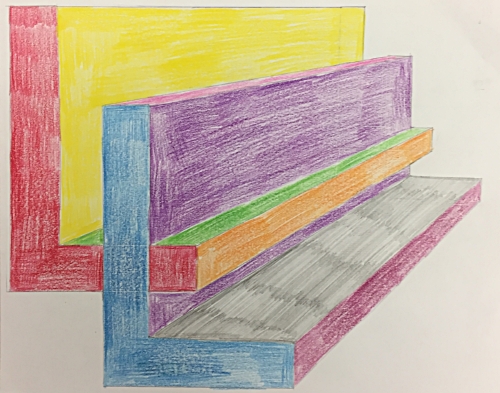
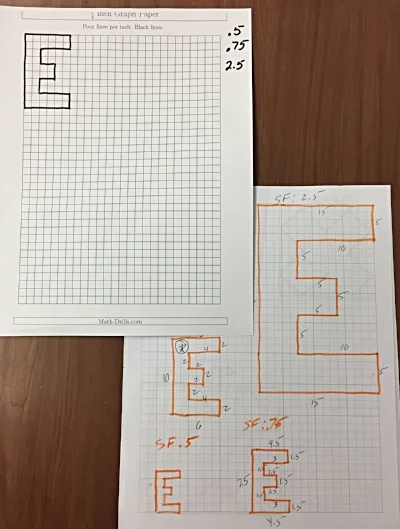
Next, we give the students a grid paper with a shape on it. We first start with a basic rectangle then move on to more complex shapes. Above are two of the sheets we used this year. We give the students a few different Scale Factors we would like them to use to create a similar object. You can see on the "E" paper on the left we used Scale Factors of 0.5, 0.75 & 2.5.
Usually after doing a few of these the students begin to understand how all the edges are increasing at the same rate.
Model the Process
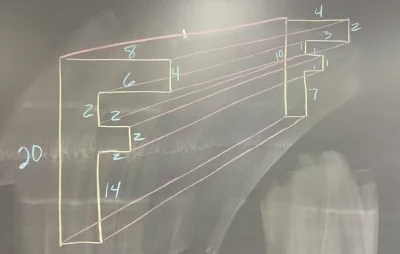
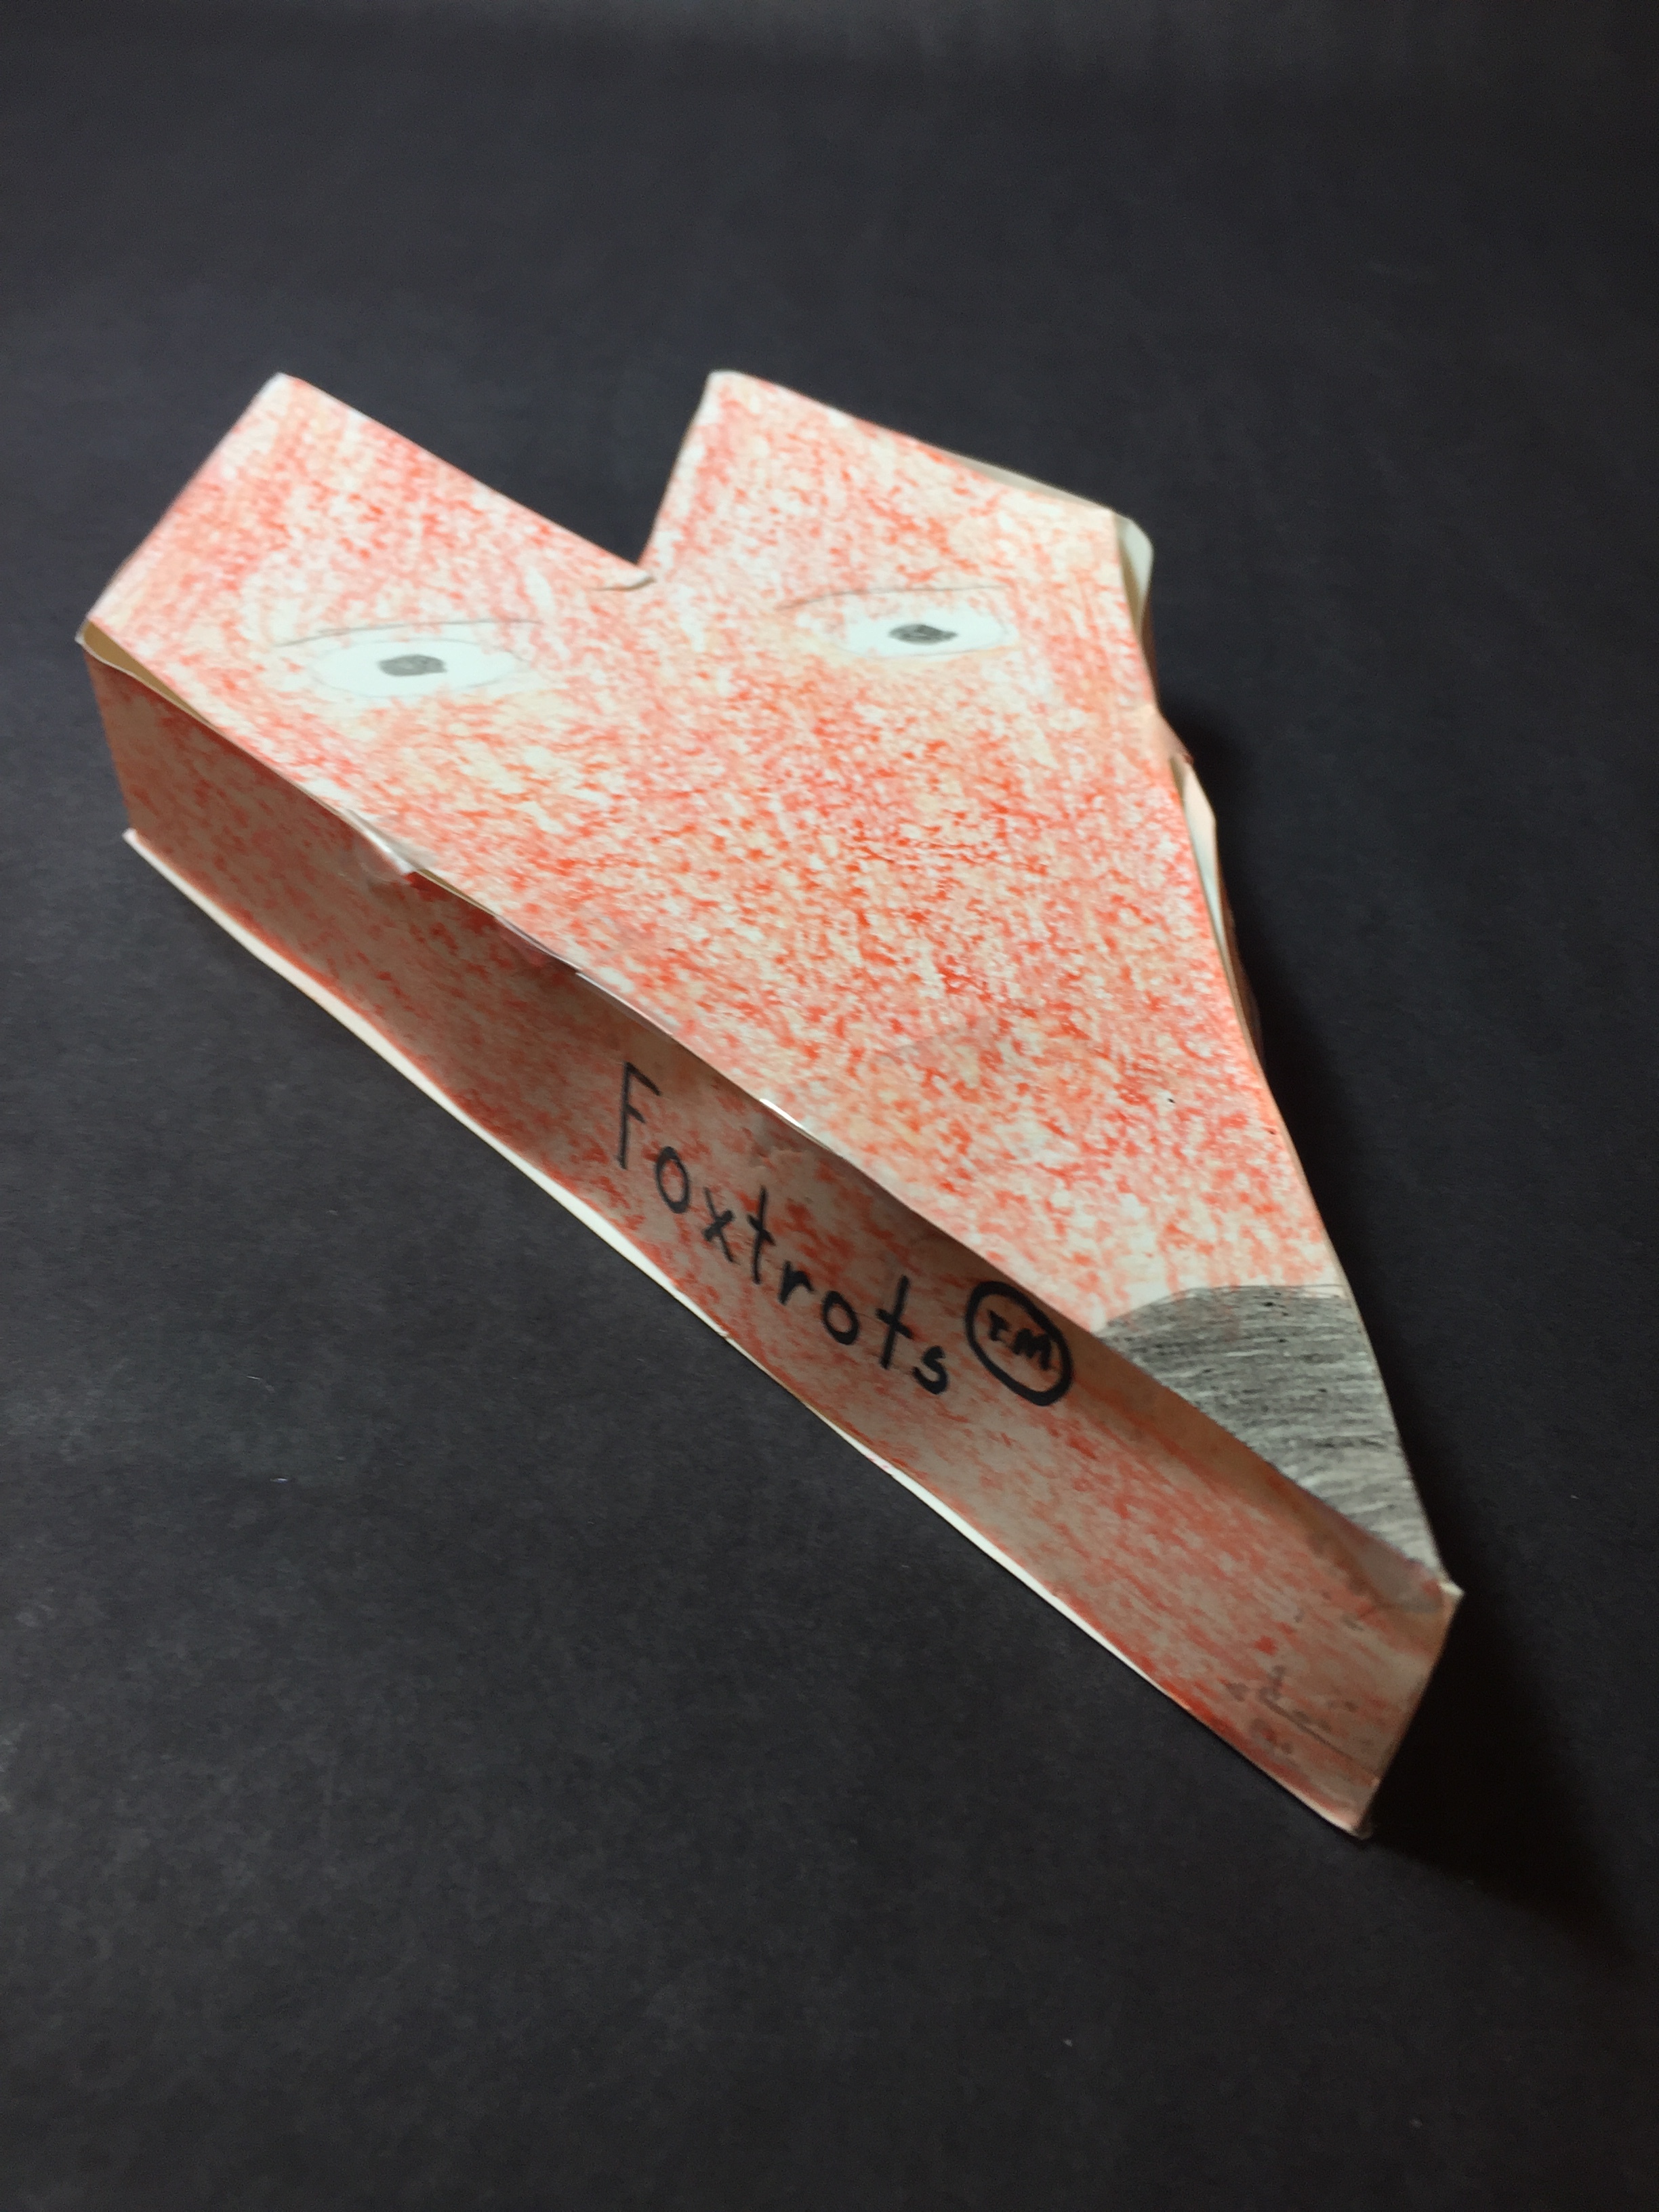
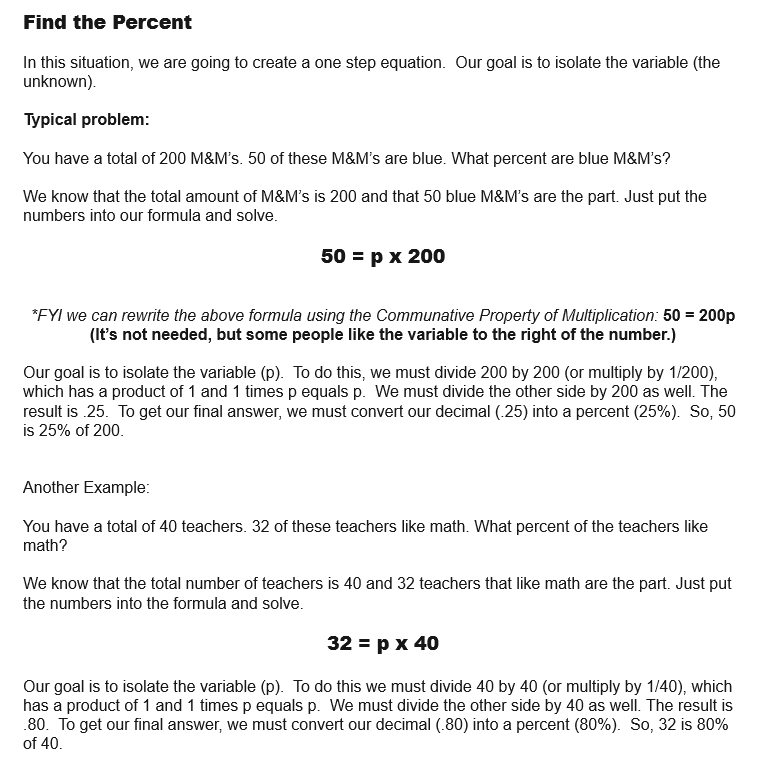
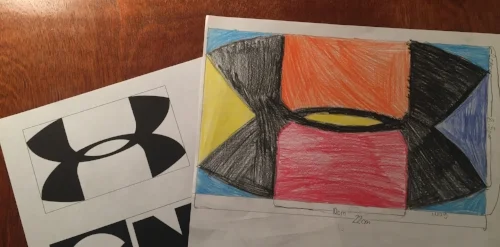
The first thing I like to do is to show them an example. I start by drawing a random object. In the example above (left) I used the letter "F." I like to use a letter with a lot of edges because it helps to show how all the different edges shrink (or enlarge) at a constant rate.
After I draw the original "F" I then draw a second letter "F" and connect all the corners. I like to have the students connect ALL the corners, even the ones that will be covered once we color. I have to students lightly draw their lines, but I like to see the lines after they have been colored over.
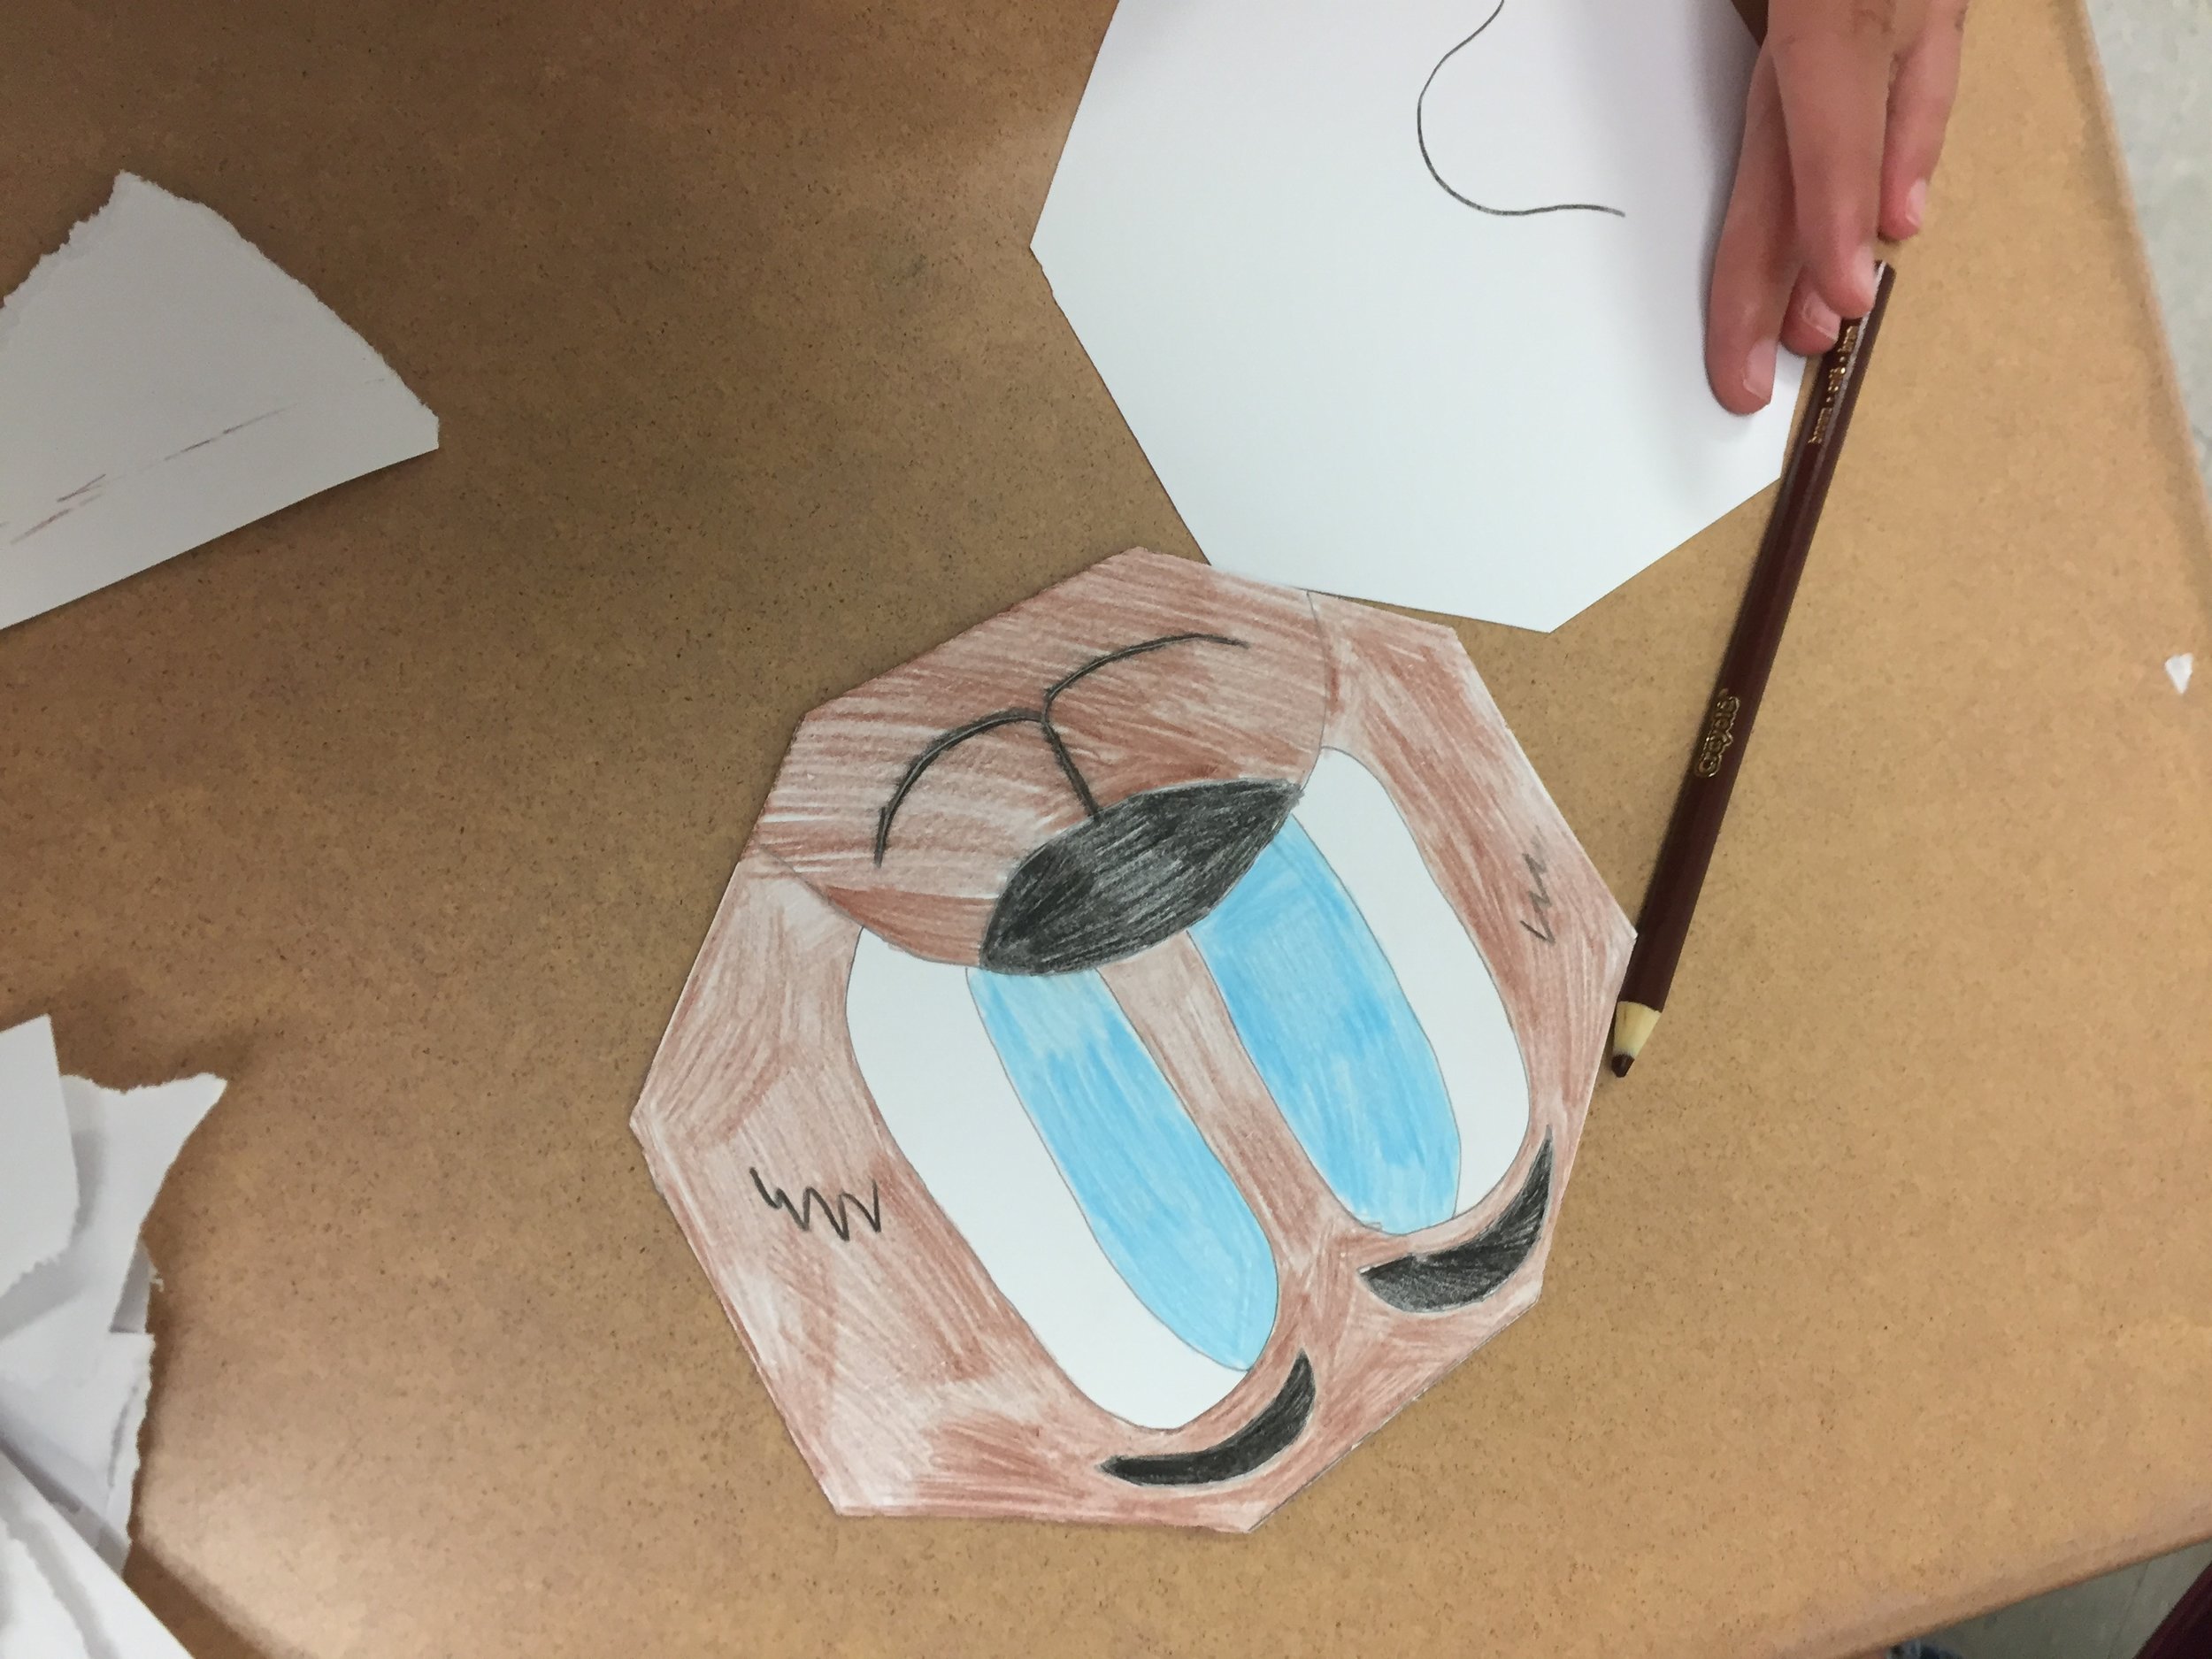
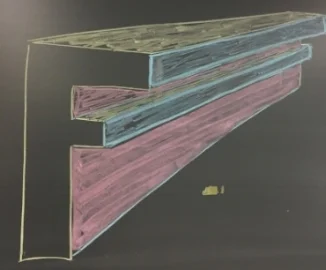
Next, I color in the different sides that would be visible. This is a real struggle for students to visualize. I try to color code my example to help the students to better visualize. In the example above right I use yellow for the tops, pink for the right side of the stem and blue for the right sides that stick out. (I realize this is not technical talk). The result is an object that has a three dimensional look.
Experiment with something Easy
I like the students to start with a very simple shape, such as a rectangle, to get a feel for the process. One of the most common mistakes is for a student to get in over their head on their very first object. After getting some experience with a simple shape it is time to move on to a more complicated shape.
Making your 3D object
Once we feel like the students understand what we are trying to do we turn them loose.
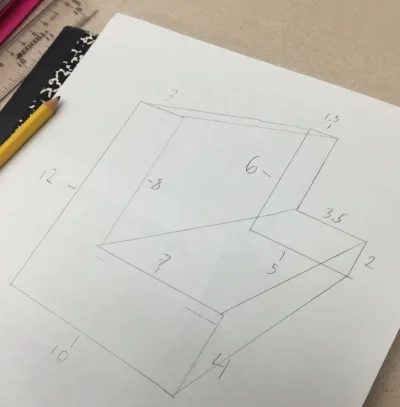
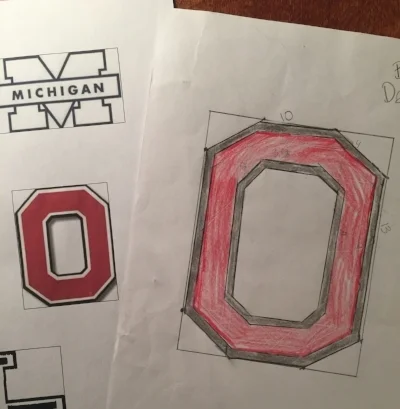
Students select a shape that they like. (We have students stay away from rounded edges until we feel like they totally grasp the concept). The students will draw the original object and then a second similar object. We usually let the student pick their own scale factor (almost always 2 or 1/2), but at times we will select a scale factor when we want to challenge the students.
Once students have drawn these two similar shapes they connect the corresponding corners.
* As a side note: where you place the second similar object will change to look of your 3D object. This is a good thing to experiment with a basic shape.
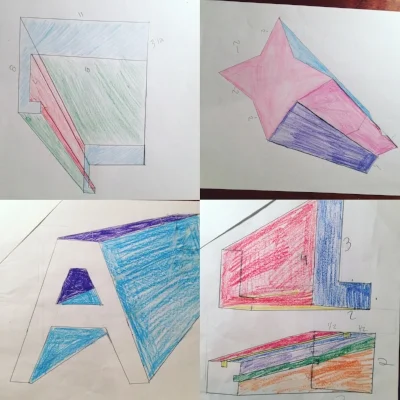
Once the two shapes have been connected it is time to color. This is a great way to determine if students can visualize what sides can be seen and which ones are blocked or partially blocked. When coloring, it is helpful to use different colors to help each side stand out. Another thing to help the shape to really stand out is you trace over the visible edges with a pencil but to push down very hard to make darker lines.
Drawing a similar object using a scale factor
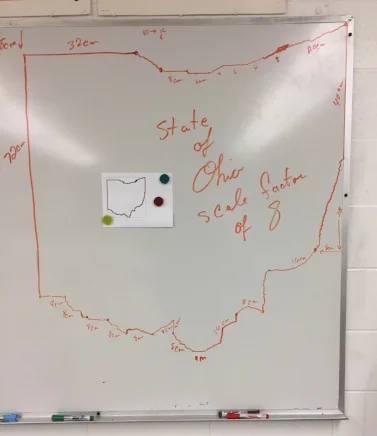
Another thing I like to do with scale factor is to have students draw an object to scale. We give students a packet of different shapes that they can select from. We have a collection of basic and challenging shapes to select from. One key thing we do to help the students is to to draw rectangles around the objects. Why? This gives the students something to help guide them.
In the example below, on the left we have a copy of the state of Ohio. Is my scale drawing of the picture of Ohio. On the original paper copy on the left the upper left corner is 1 cm below the corner of the rectangle. When I did the scale drawing of Ohio I used a scale factor of 8. As a result, I measured down 8 cm from the upper left corner of my rectangle.
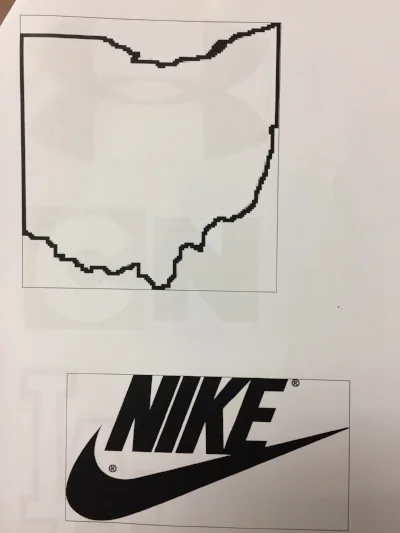
Below are a couple of examples of students drawing similar objects using a scale factor.
Todd Hawk is a middle school math teacher and the Founder of the Land of Math LLC (www.landofmath.com). You can reach him at landofmath2@gmail.com or follow him on twitter: @landofmath2 and Instagram: @landofmath
Creating a Successful Math Newsletter
One of the things we try to do each year is to create a math newsletter to share with parents, students and administration. The main reason is to help develop better communication with parents. The development of our newsletter is an ever evolving process, but we feel like we have hit on some key things that make our newsletter very effective.
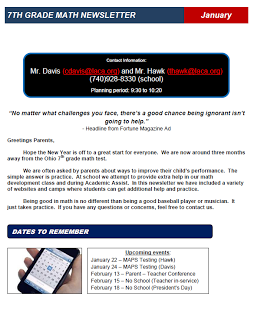
At the start of the year we focus on gathering the email addresses of different parents, students and any one else that might want the newsletter. We have been able to get around 90% of our student's families to sign up. When we send out the newsletter we just email a PDF to the different people on our email list. We mail copies to families that did not sign up for email. We also make extra copies and leave in the classroom for students that might not see the email version. In the past we sent out newsletters each month. This year we are attempting to send out one a quarter.
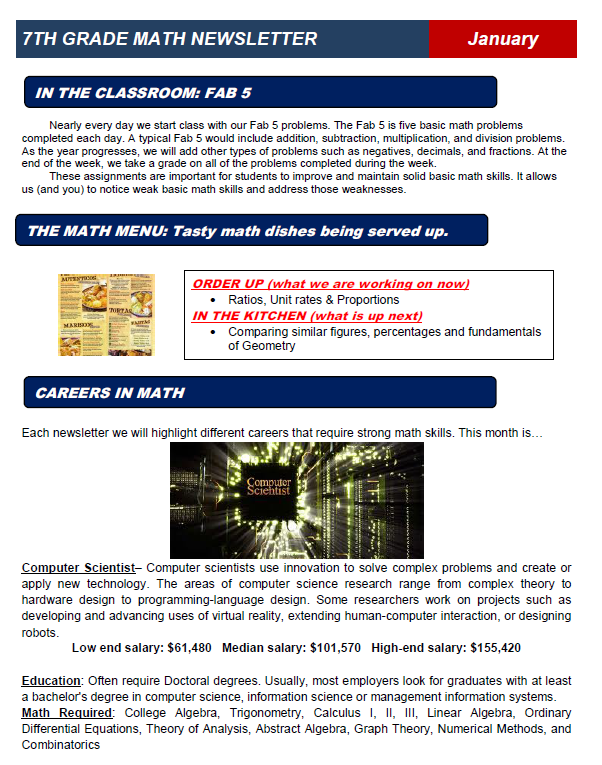
Above is a sample of one of our newsletters. The rest of this article will focus on the content, features and structure of the newsletter.
#1 Headline: The first thing we do on our newsletter is state what it is and for what time period. In this case we call the newsletter the "7th grade math newsletter" (yes we know, verrrrry creative). If we had newsletters for each individual teacher we might have use something like Mr. Mitchell's Math Class (also very boring) or perhaps something slightly more interesting such as Math Mania.
#2 Contact Information: This part of our newsletter includes information such as Names, email address, school phone, planning period times, website, etc.
#3 Quote: We like to have a quote about dealing with one of two topics: 1) Importance of math and/or 2) Motivational.
#4 Greeting: We address this to the parents despite the fact that many of the readers of the newsletter are our students.
#5 Dates to Know: Just like it sounds. We focus on big events such as early releases, no school, end of grading period, parent - teacher conferences, etc.
#6 Classroom Activity: In this section of the newsletter we highlight an activity that takes place in the classroom. For example, this newsletter mentions our "Fab 5" which is a basic skills review at the start of each class. In this section we might mention a math program we are using, special projects, or discuss our invention program.
#7 Upcoming Topics: In this section we list what we are currently working on in class and what parents can expect in the next few weeks.
#8 Math Careers: One of our goals is to let parents and students know about the many career options available in mathematics. It seems obvious to us, but many students have no idea about the math needed in different careers. A couple of weeks ago a student told me how he wanted to be an architect but was stunned to find out math was required math.
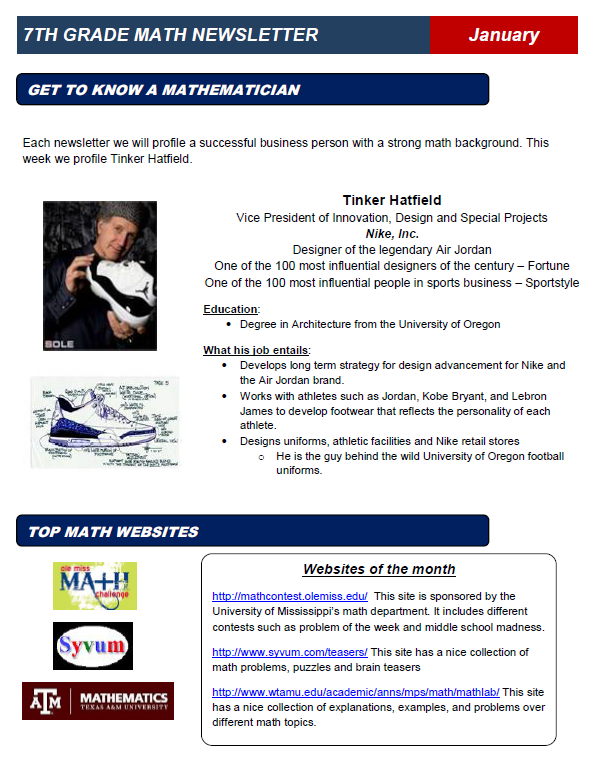
#9 Get to Know a Mathematician: Here we are Highlighting a person that has a career that uses math. We like to focus on interesting jobs/people that are unique. In this newsletter we focused on Tinker Hatfield the person that worked on designing Air Jordan shoes. We make a conscious effort to have an equal amount of men and women.
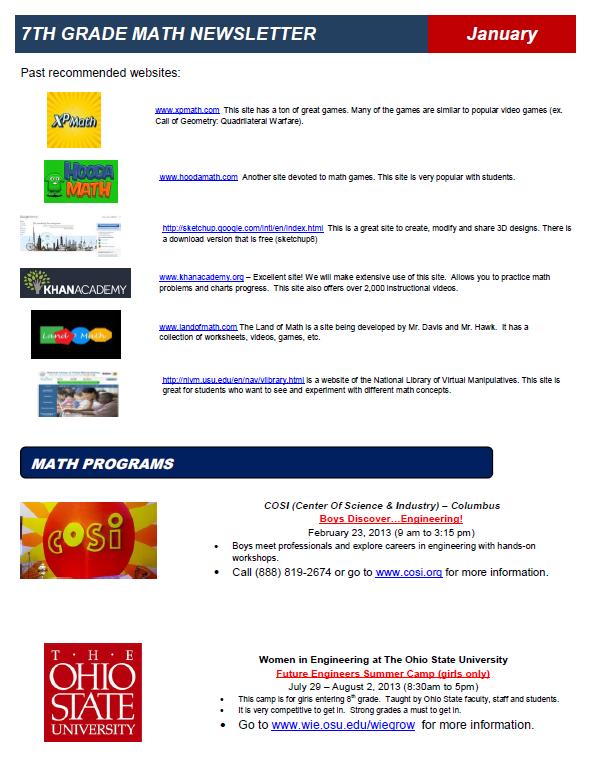
#10 Websites of the Month/Quarter: We feature two or three sites that we feel could be helpful and sometimes interesting. In theory parents and students can use these sites for extra practice or assistance.
#11 Past Websites of the Month/Quarter: Instead of deleting our past website selections we keep them as a running list. As the school year progresses this turns into a nice collection of resources for the student, parent and even teacher.
#12 Math Programs: Our school is located just 30 minutes outside of Columbus, Ohio and just 45 minutes from The Ohio State University. This location allows us to have access to a variety of math programs.
In each newsletter we try to promote local Science, Tech, Engineering, and Math (STEM) programs. This is information that most parents are not aware of. By listing these programs many of our families are able to find items that interest their kids.
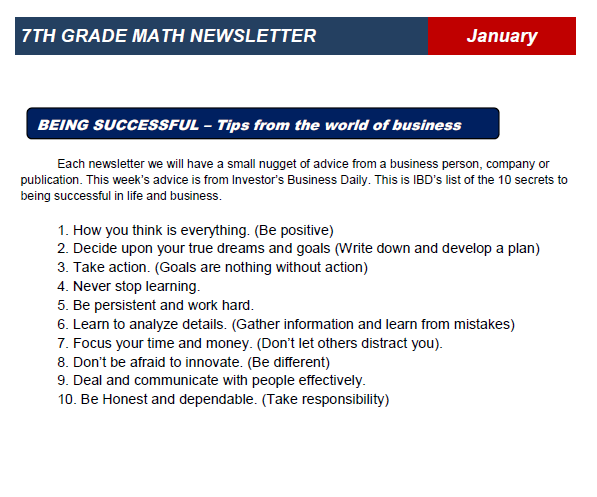
#13 Tips on Being successful: Finally we include some words of wisdom from top business leaders. The theme of this section usually focuses on work ethic, goals, and perseverance.
Todd Hawk is a middle school math teacher and the Founder of the Land of Math LLC (www.landofmath.com). You can reach him at landofmath2@gmail.com or follow him on twitter: @landofmath2.